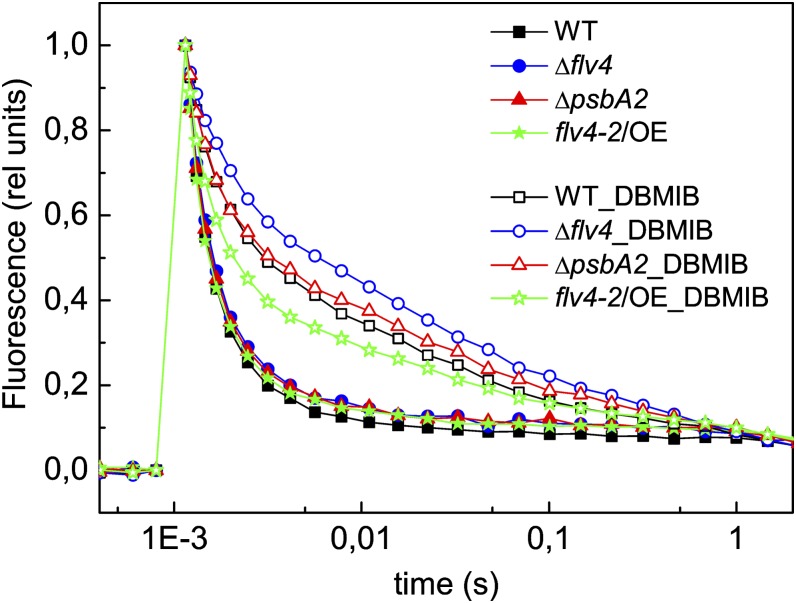
Figure 9.
Flash-induced chlorophyll fluorescence relaxation curves in darkness from wild-type, ΔpsbA2, flv4-2/OE, and Δflv4 strains, grown in LC conditions. The curves were recorded in the absence (closed symbols) and in the presence of 20 µM DBMIB (open symbols). The cultures were adjusted to a chlorophyll concentration of 5 µg mL−1. To facilitate the comparison of the curves, F0 and FmD values were normalized to 0 and 1, respectively. The fluorescence traces are the mean of three independent experiments. rel unit, relative unit; WT, wild type. [See online article for color version of this figure.]

