Figure 3.
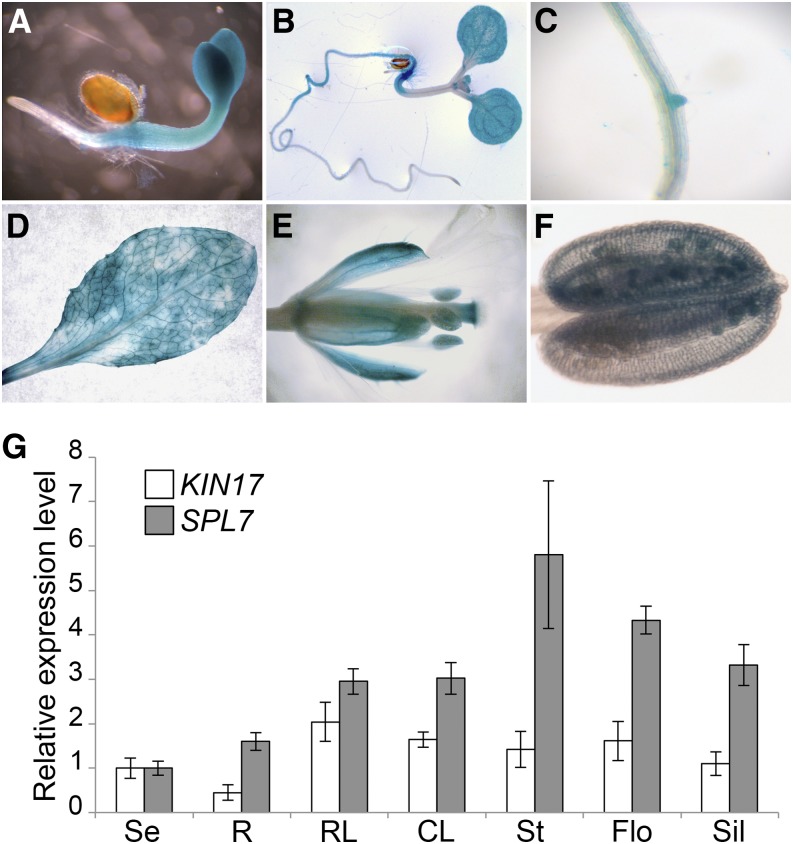
Characterization of the KIN17 spatial expression pattern. A to F, Histochemical GUS staining in pKIN17::GUS lines. A and B, Five-day-old (A) and 7-d-old (B) seedlings. C, Root vasculature. D, Rosette leaves. E, Postanthesis flowers. F, Anthers. G, KIN17 and SPL7 distribute mainly on aerial organs. Total RNA from seedlings and different adult plant organs, seedlings (Se), roots (R), rosette leaves (RL), cauline leaves (CL), stems (St), flowers (Flo), and siliques (Sil), was isolated and reverse transcribed to cDNA. KIN17 and SPL7 mRNA relative amounts were measured by qPCR with specific oligonucleotides and normalized to ACTIN1 and ELONGATION FACTOR1α levels. Error bars correspond to the sd of technical replicates (n = 3).

