Figure 4.
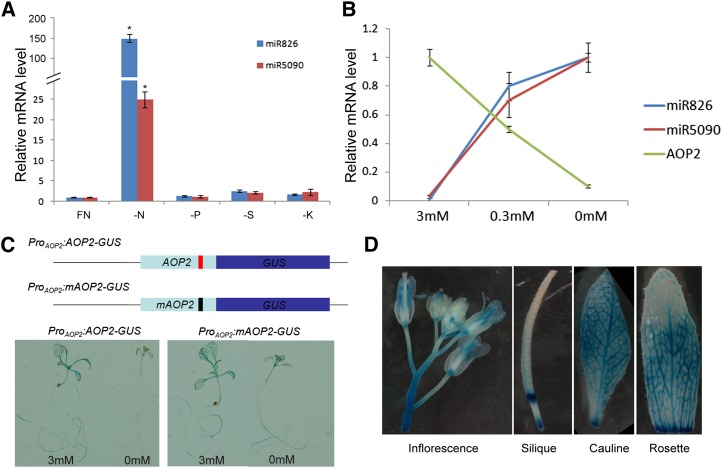
AOP2 is regulated posttranscriptionally. A, Expression of miR826 and miR5090 under different nutrient deficiencies. FN, Full nutrient; K, potassium; N, nitrogen; P, phosphorus; S, sulfur. The Student’s t test indicated that the values marked by one asterisk are significantly different from the corresponding wild-type value (P < 0.01; n = 3). B, Expressions of miRNAs and AOP2 under nitrogen starvation. A and B, Ten-day-old seedlings were used for RNA extraction. The qRT-PCR analysis was repeated for three biological replicates, each of which consisted of three technical replicates. The error bars represent the sds from triplicate samples. C, GUS staining under nitrogen starvation conditions. The scheme represents two reporters with wild-type or mutated AOP2. Ten-d-old seedlings were used for GUS staining. D, GUS staining under different tissues and organs. The 2-month-old ProAOP2:AOP2-GUS reporter line was used for GUS staining.

