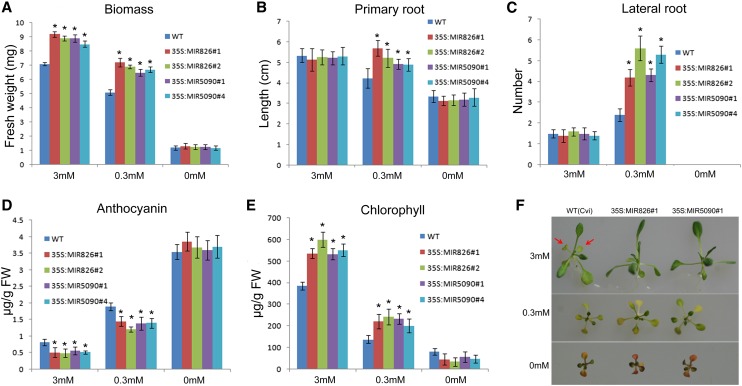
Figure 7.
Transgenic plants are less sensitive to nitrogen starvation. A, Biomass. Values are the means of three replicates of 20 plants. B, Primary root length. C, Lateral root density. D, Anthocyanin concentration. Shoots were harvested for analysis. E, Chlorophyll concentration. Shoots were harvested for analysis. A to E, Ten-d-old plants grown on plates were used for analysis. Error bars indicate the sds (n = 3). Asterisks indicate statistical significance at P < 0.01 compared with the wild type (Student’s t test). F, Three-week-old seedlings grown on medium with the indicated nitrogen concentrations.

