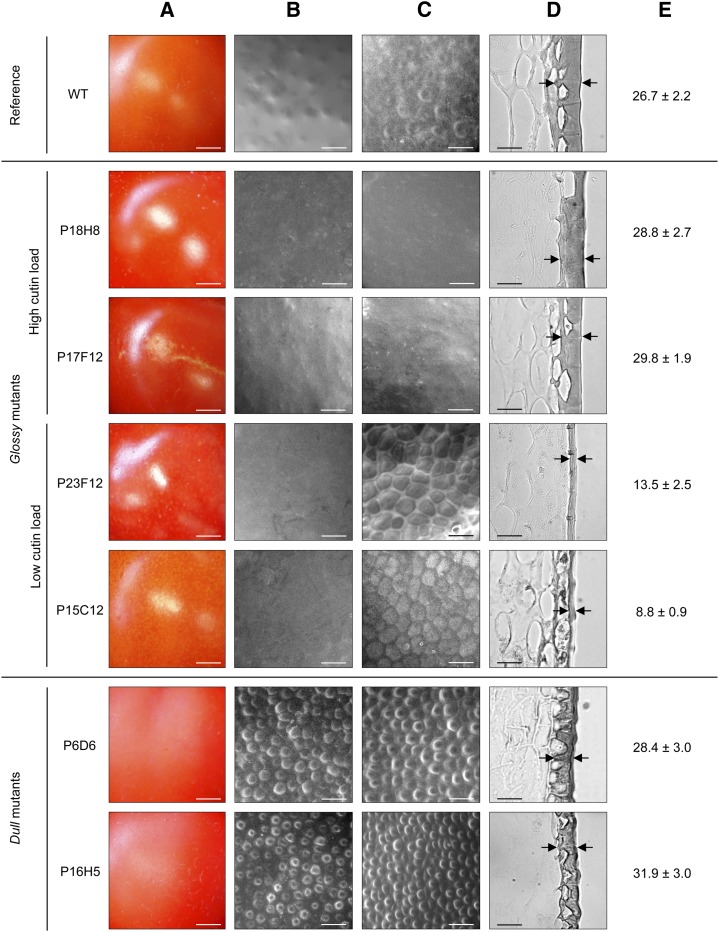
Figure 5.
The surface and cuticle from the wild type (WT) and selected glossy and dull mutants fruits at RR stage. A, Light macroscopy images showing cuticle brightness. B, ESEM of native fruit surface. C, ESEM of de-waxed fruit surface. D, Light microscopy of fruit exocarp sections stained with Sudan IV. Black arrows show examples of cuticle thickness measurement points. E, Cuticle thickness measurements of pericarp sections stained with Sudan IV. Mean values (in micrometers) of 40 measures on 3 different sections are given with sd. Scale bar = 5 mm in A; 40 µm in B and C; 30 µm in D. [See online article for color version of this figure.]

