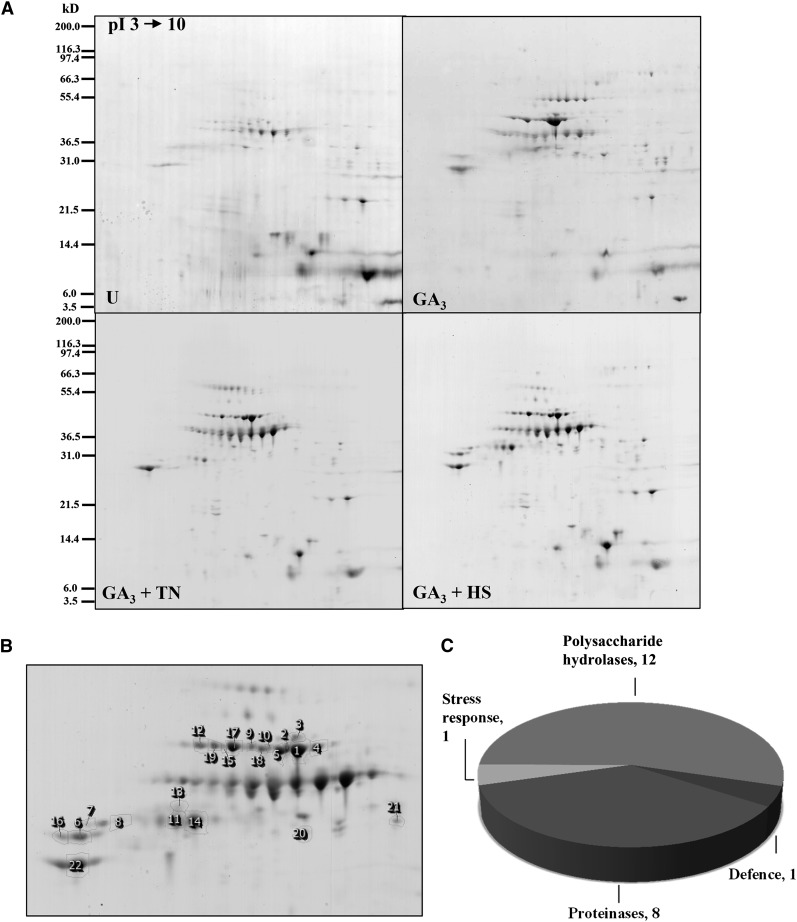
Figure 4.
Extracellular protein profiles of barley aleurone layer extracts. A, One representative colloidal Coomassie blue-stained gel covering the pH range 3 to 10 is shown for each treatment. Molecular size markers are indicated at left. U, Untreated. B, Closeup view of the reference gel showing 22 identified spots. C, Functional categories of the plant proteins identified. (For details about protein identifications, see Supplemental Table S2).

