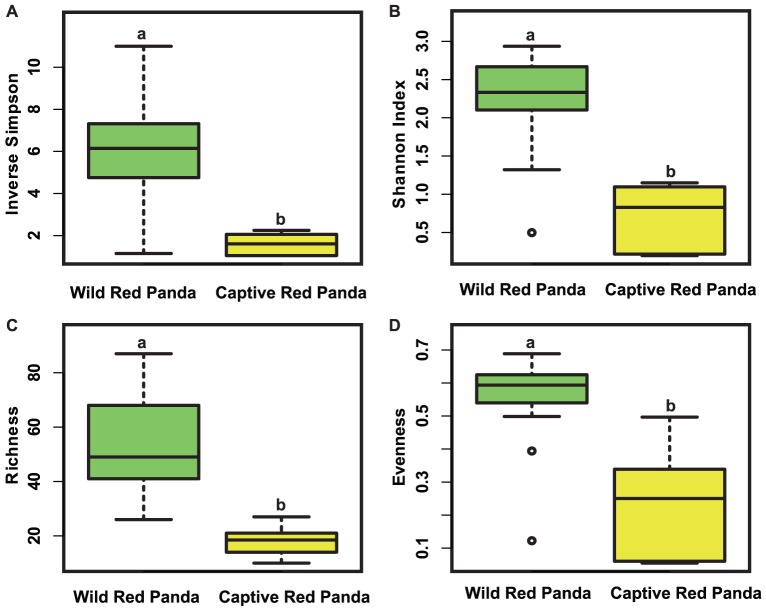
Figure 1. Comparison of community alpha diversities between the wild and captive red pandas.
Diversity was measured by inverse Simpson (A) and Shannon index (B); Richness (C) and evenness (D) were measured by the number of observed OTUs and Shannon Evenness index, respectively. The top and bottom boundaries of each box indicate the 75th and 25th quartile valudes, respectively. The black lines within each box represent the median values. Different lowercase letters above the boxplots indicate significant differences in alpha diversities between wild and captive pandas (P<0.001, Mann Whitney test).

