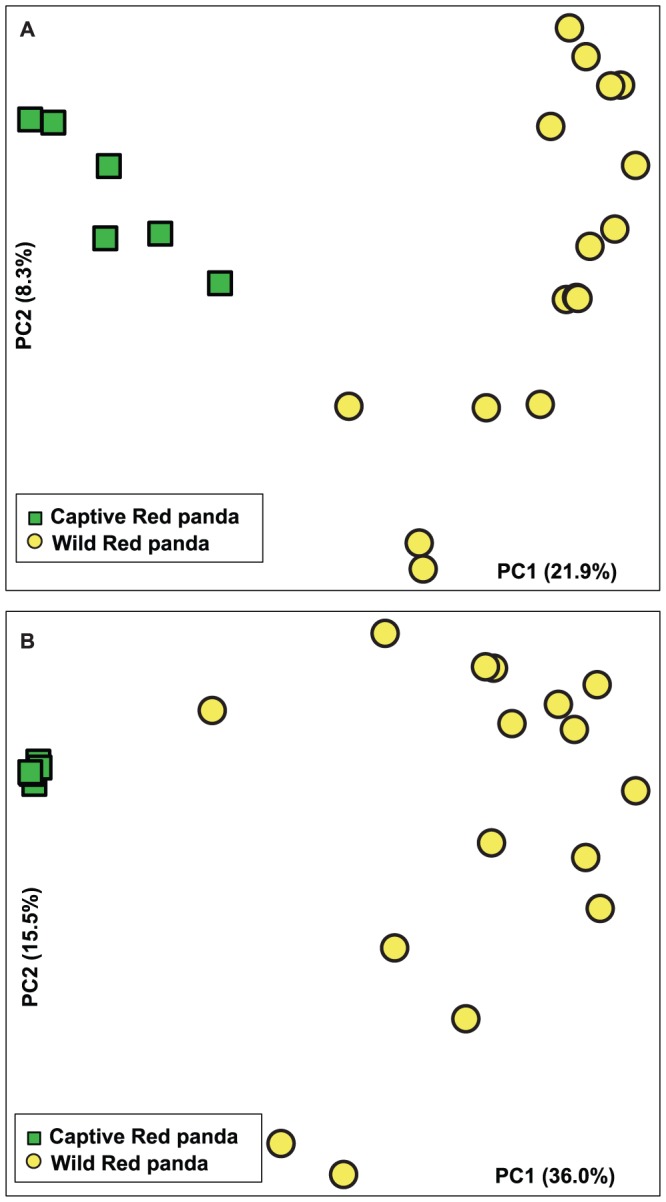
Figure 2. Principal coordinate analysis of the community membership (A) and structure (B) using Jaccard and Theta YC distances, respectively.

Green squares and yellow circles represent captive and wild red panda bacterial communities, respectively. Distances between symbols on the ordination plot reflect relative dissimilarities in community memberships or structures.
