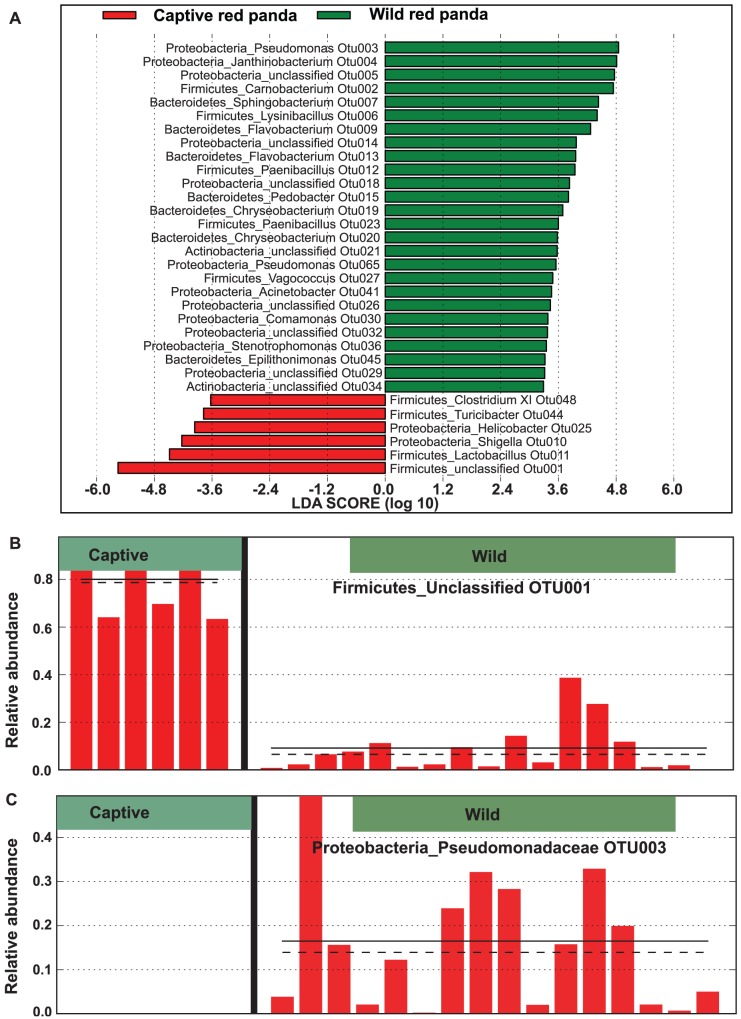
Figure 5. OTUs differentially represented between wild and captive red pandas identified by linear discriminant analysis coupled with effect size (LEfSe).
A. Histogram showing OTUs that are more abundant in wild (green color) or captive (red color) red pandas ranked by effect size. The distribution of the most differentially distributed OTUs: OTU001 (more abundant in captive red pandas) and OTU003 (more abundant in wild red pandas) were illustrated in B and C, respectively.

