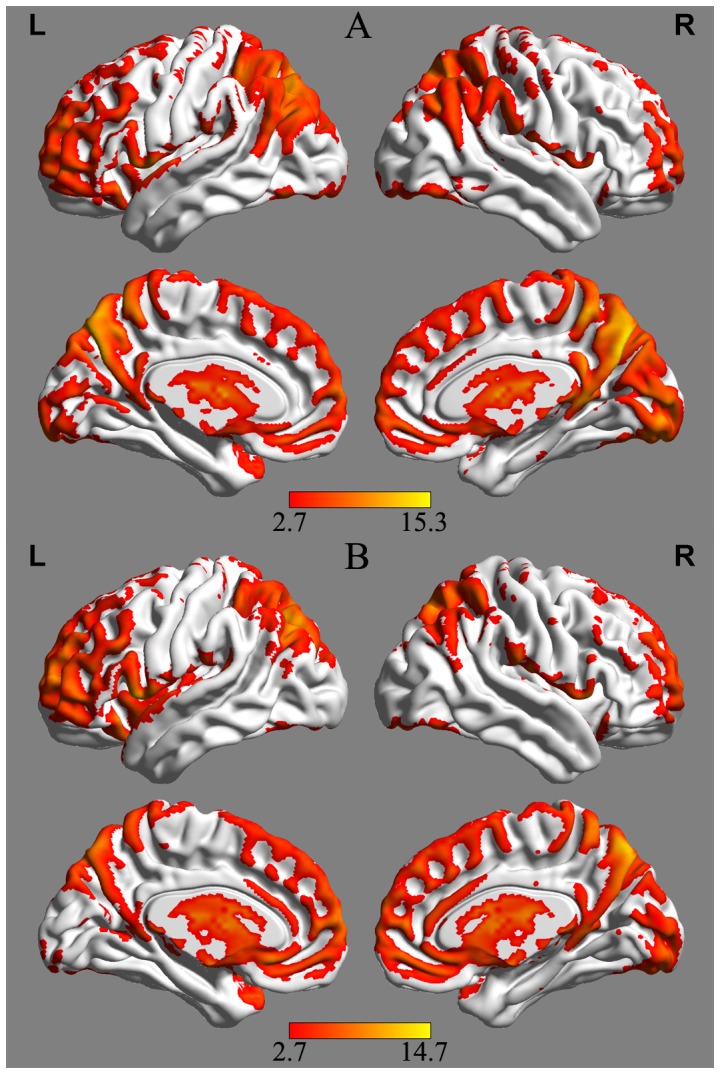
Figure 1. Mean amplitude of low-frequency fluctuation (ALFF) maps from the control group (A) and the subcortical ischemic vascular dementia (SIVD) group (B).

Visual inspection indicated high ALFF values in several regions, including the anterior cingulate cortex (ACC), posterior cingulate cortex (PCC), and the adjacent precuneus. The left side of the image denotes the left side of the brain. Color bars represent the t value of the group analysis. The t statistical maps were created using the BrainNet Viewer (http://www.nitrc.org/projects/bnv/).
