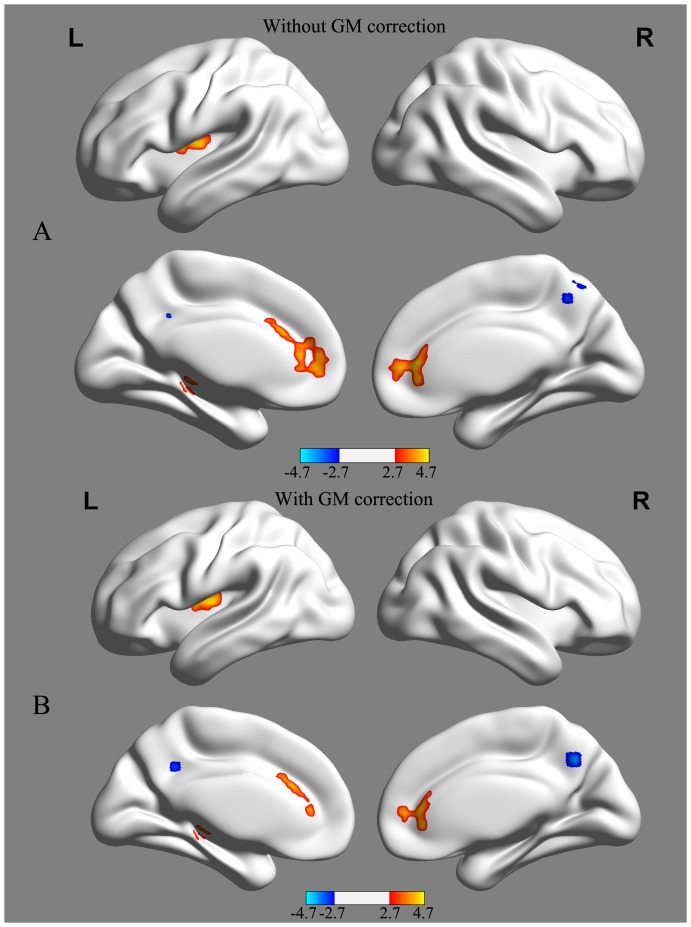
Figure 2. ALFF differences between SIVD and control groups without (A) and with (B) GM volume correction, respectively.
SIVD patients showed reduced ALFF values in the bilateral precuneus and increased ALFF values in the bilateral ACC, left insula and hippocampus. Of note, the between-group differences in the ALFF values exhibited highly similar patterns between with and without correcting GM volume. Statistical thresholds were set at P<0.01 for individual voxels and a cluster size >1080 mm3, which corresponds to a corrected P<0.01 determined by Monte Carlo simulations. Color bars represent the t value of the group analysis. Cool color represents decreased ALFF values, and warm color represents increased ALFF values. The t statistical maps were created using the BrainNet Viewer (http://www.nitrc.org/projects/bnv/).

