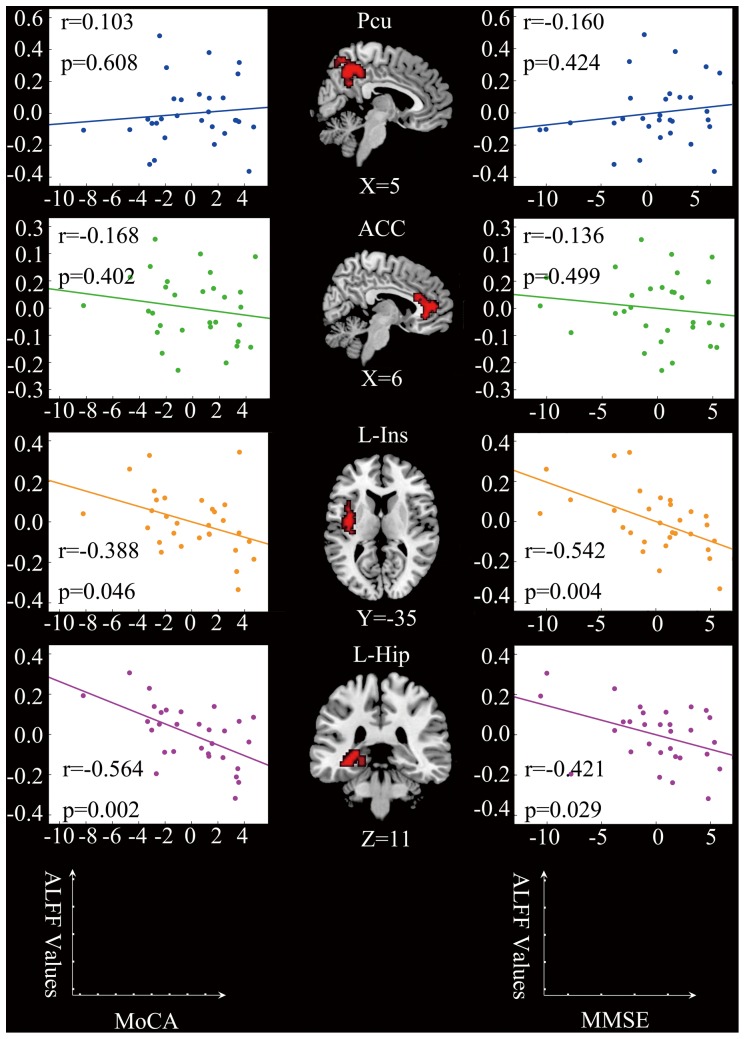
Figure 3. Correlations between ALFF values and cognitive performance of patients with SIVD.
Left column: partial correlation analysis between MoCA scores and ALFF values. There were negative correlations between the MoCA scores and the average ALFF values of the left insula (r = −0.388, p = 0.046) and the left hippocampus (r = −0.564, p = 0.002). Middle column: regions showing differences in ALFF values between SIVD patients and control subjects (SIVD>HC, p<0.01, AlphaSim corrected). Right column: partial correlation analysis between MMSE scores and ALFF values. There was negative correlation between the MMSE scores and the average ALFF values of the left insula (r = −0.542, p = 0.004) and the left hippocampus (r = −0.421, p = 0.029). The effects of age, gender, years of education, and GM volume were corrected as covariates. Each dot represents data from one participant.

