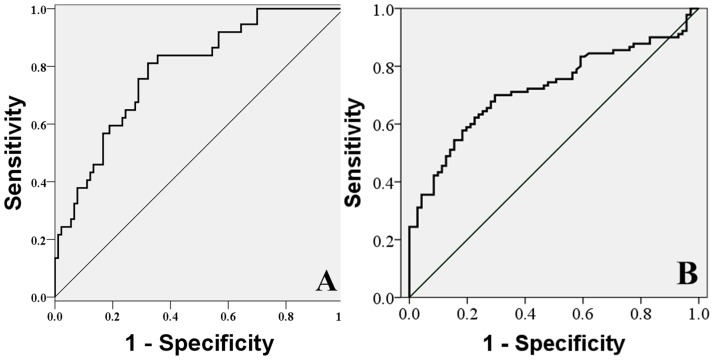
Figure 5. Receiver-operating characteristic (ROC) curve between each grade in the NP and cut-off value.
The most accurate point was obtained from the ROC curve as the cut-off value. A. The T2 cut-off value between grades I and II was found to be 62.03 ms, sensitivity 83.80%, specificity 64.40%, and Area Under curve (AUC) 0.785, separately. B. The values between grades II and III were 54.60 ms, 66.80%, 71.18%, and 0.722, separately.

