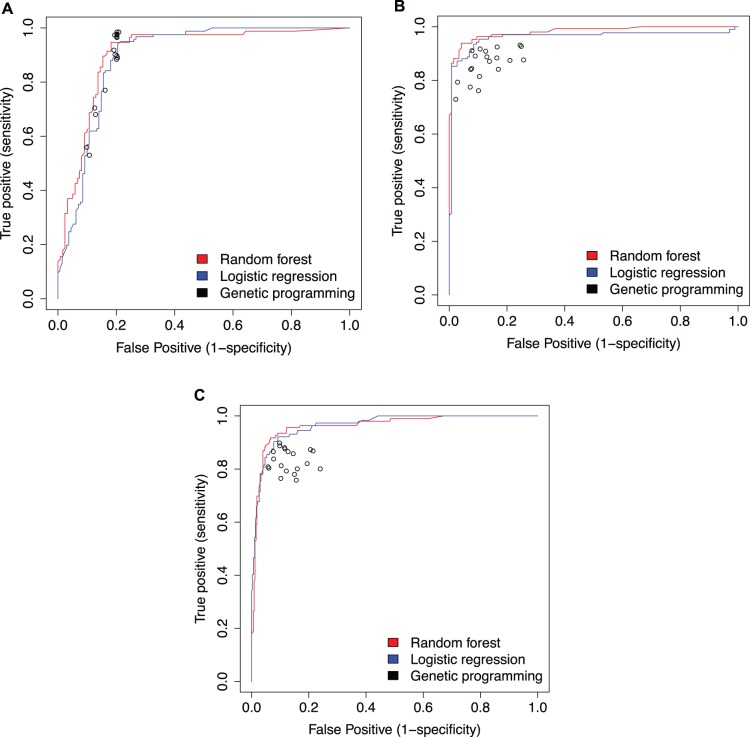
Figure 2. A comparison of the classification accuracies for each machine learning technique.
This figures shows the accuracy of different classifiers at classifying microbial communities into BV categories. The red and blue lines show the accuracy of random forest and logistic regression classifiers respectively. The black dots are different genetic programming models. Panel A shows the results using the Srinivasan et al. dataset and Amsel BV. Panel B uses the Srinivasan et al. dataset and Nugent score BV. Panel C uses the Ravel et al. dataset and Nugent score BV.

