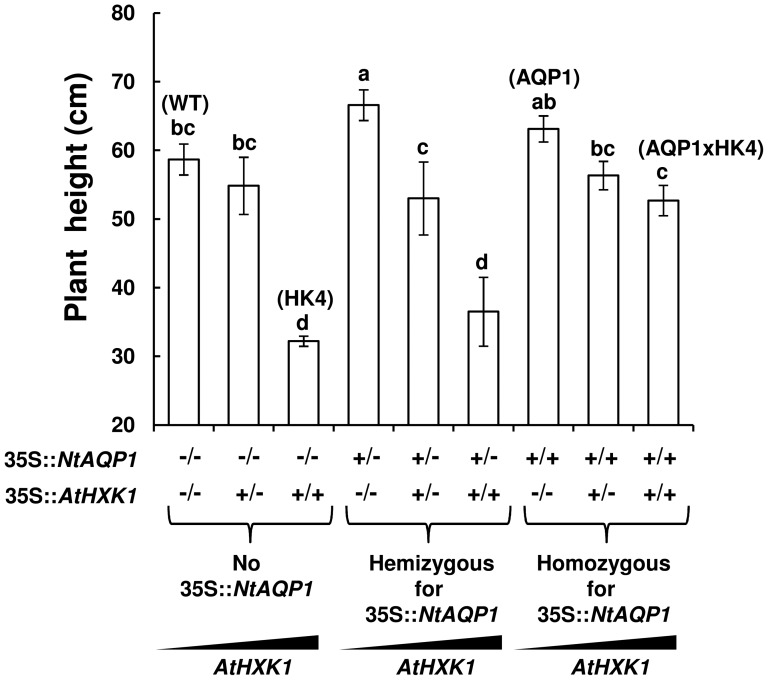
Figure 3. Plant growth is affected by NtAQP1 and AtHXK1 gene dosage.
Height of transgenic plants with one copy (hemizygous, +/−) or two copies (homozygous, +/+) of AtHXK1 and NtAQP1. The zygosity state of each gene is specified on the x-axis. −/− indicates the absence of the specified gene, −/+ indicates hemizygosity and +/+ indicates homozygosity. Three left columns: no NtAQP1; middle three columns: hemizygous for NtAQP1; three right columns: homozygous for NtAQP1. Data are means of at least six independent repeats ± SE. Different letters indicate a significant difference (t test, P<0.05).

