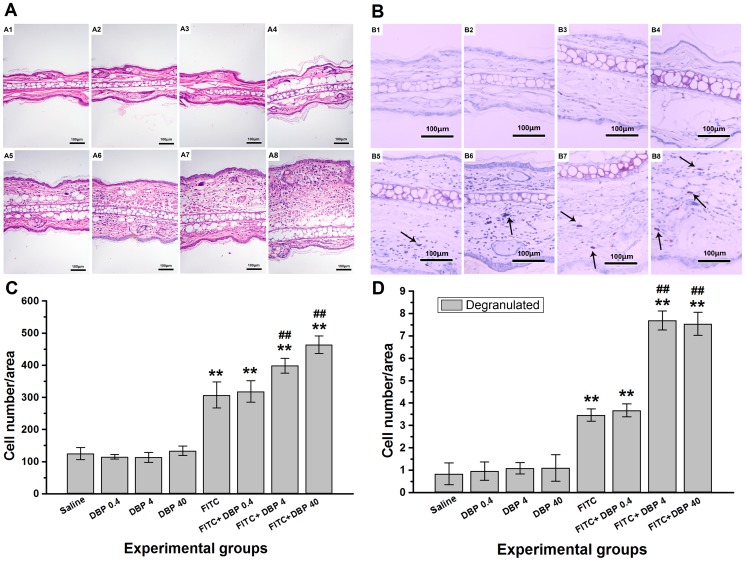
Figure 4. Effects of skin exposure to DBP on histological changes in the ear.
(A) Stained with hematoxylin & eosin (H&E). (B) Stained with toluidine blue, degranulation mast cells were stained purple color (black arrow). (C) Number of inflammatory cells infiltrating. (D) Number of mast cells degranulating. In (A) and (B), A1–A8 or B1–B8 represent different exposure groups (saline, DBP 0.4, DBP 4, DBP 40, FITC, FITC+DBP 0.4, FITC+DBP 4, FITC+DBP 40). **: p<0.01, compared with the saline group; ##: p<0.01, compared with the FITC group.

