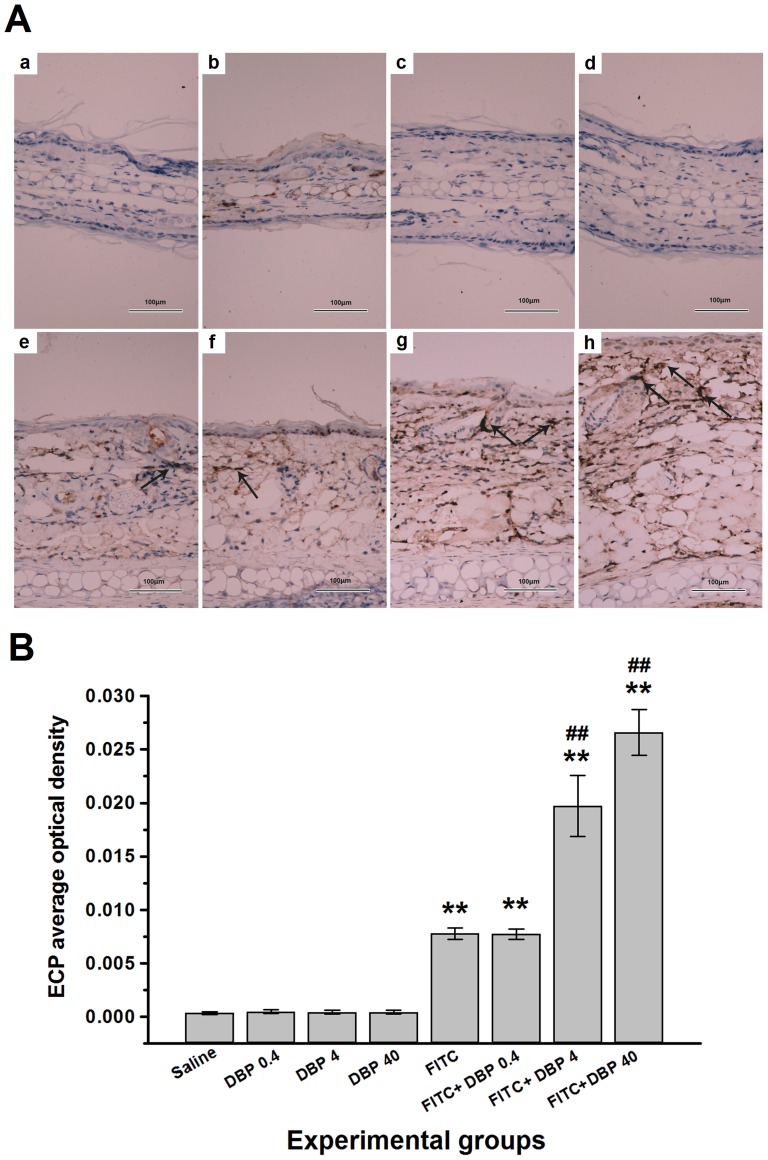
Figure 5. Immunohistochemical analyses.
Representative images of the expression of (A) eosinophil cationic protein (ECP) as determined by immunohistochemical staining (brown color stain) (black arrow). Panel: (a) Saline, (b) DBP 0.4, (c) DBP 4, (d) DBP 40, (e) FITC, (f) FITC+DBP 0.4, (g) FITC+DBP 4, (h) FITC+DBP 40. Analyses of (B) ECP expression level according to average optical density. Animal groups (in all panels): n = 4 mice per group. **: p<0.01, compared with saline group; ##: p<0.01, compared with FITC group.

