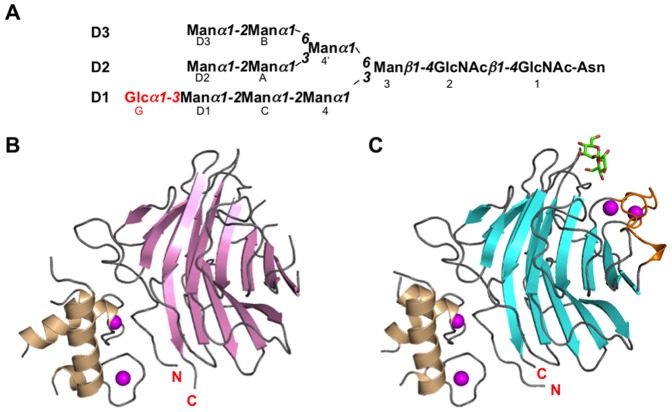
Figure 1. Overall structures of binary and ternary complexes of ERGIC-53–CRD.
(A) Schematic representation of Glc1Man9GlcNAc2 showing the nomenclature of oligosaccharide residues and branches. Glucose residue is shown in red. Ribbon models of binary and ternary complexes of ERGIC-53–CRD are shown in (B) and (C), respectively. Ca2+-free ERGIC-53–CRD and Ca2+/α2-Man3-bound ERGIC-53–CRD are colored pink and cyan, respectively. MCFD2 is shown in wheat. The bound α2-Man3 and Ca2+ ions are shown as green stick and magenta sphere models, respectively. In the trimannosyl ligand, the two mannose residues giving unambiguous electron densities were drawn. Ca2+-binding loops (residues 155–161 and 176–185) are highlighted in orange in (C).

