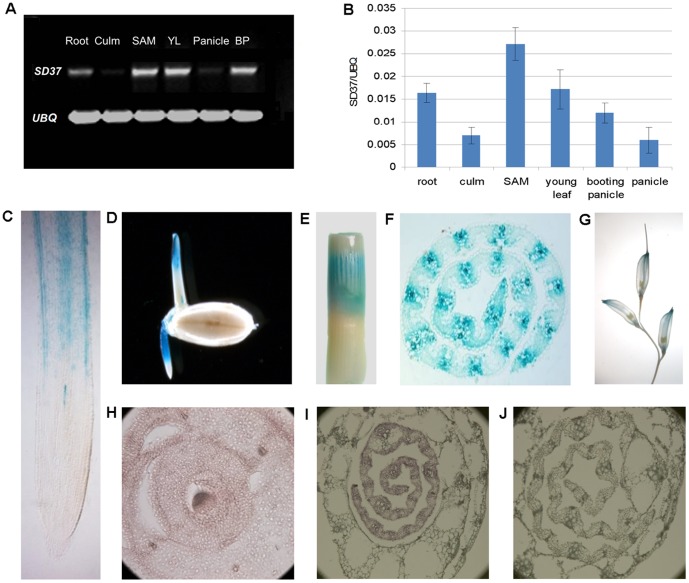
Figure 5. The expression pattern of SD37.
(A)–(B) SD37 expression levels were measured by RT-PCR and real-time PCR in various organs, including the root, culm, SAM, young leaf, booting panicle, and panicle. Expression values are the average of 10 samples ± SD. (C)–(G) GUS expression (blue staining) patterns in the p1391Z_SD37pro::GUS transgenic line in different organs. (C) Root cross-section; (D) seeds with coleoptile and radicle; (E) culm; (F) young leaf cross-section; and (G) booting panicle. (H)–(J) SD37 expression around the shoot apical meristem as revealed by RNA in situ hybridization. (H) Shoot apical meristem; (I) young leaf; and (J) young leaf (negative control) preparation examined with a sense SD37 probe.

