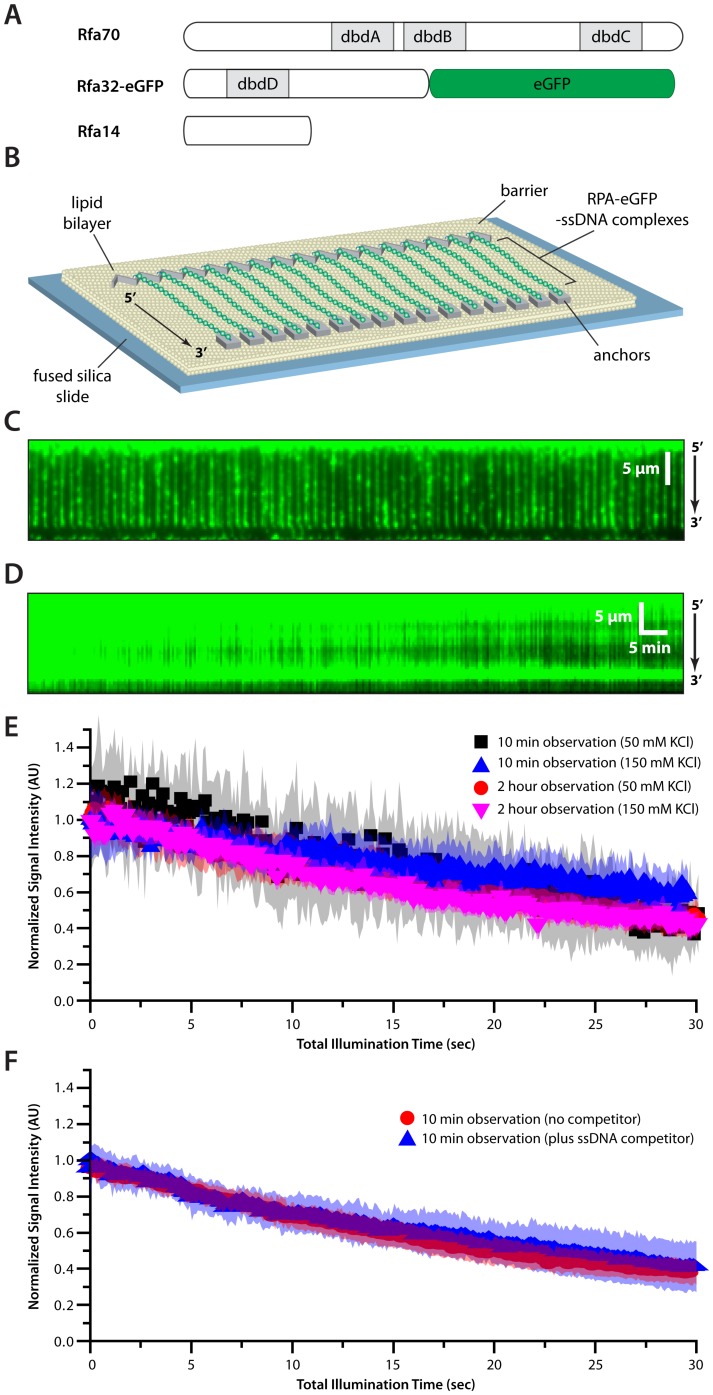
Figure 1. Single-stranded DNA curtain assay for RPA binding.
(A) Schematic illustration of S. cerevisiae RPA showing the location of the four primary DNA-binding domains (dbdA-D) and the location of the eGFP tag at the C-terminus of RPA32. (B) Overview of RPA-ssDNA curtains showing the nanofabricated patterns on the surface of a fused silica microscope slide. All of the ssDNA molecules are anchored with their 5′ ends aligned along the leading edges of zig-zag shaped chromium (Cr) barriers [38], and their 3′ ends anchored through nonspecific adsorption to the exposed Cr pentagons, as depicted [40]. (C) Wide-field TIRF microscopy image of an ssDNA-curtain bound by RPA-eGFP. The 5′ to 3′ orientation of the ssDNA is indicated. Also see Video S1. (D) Kymograph showing a single RPA-eGFP/ssDNA complex with 100-msec images collected at 24-second intervals over a period of 2 hours. (E) Loss of RPA-eGFP signal is due to photo-bleaching. (F) Dissociation of RPA-eGFP is not accelerated in the presence of 1 µM competitor ssDNA. For both (E) and (F) intensity measurements for RPA-eGFP/ssDNA complexes viewed at 2-second intervals for a period of 10 minutes, or at 24-second intervals over 2 hours, as indicated. The total laser illumination period was the same under both experimental conditions. Each curve represents the normalized average calculated from 11–22 different ssDNA molecules collected at 50 or 150 mM KCl, and shaded regions correspond to the standard deviation for each data set.

