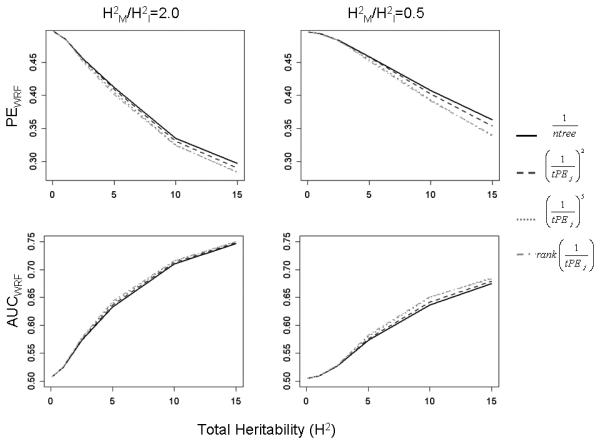
Figure 1.

Simulation Results (wPE and wAUC), m=2 causal pairs.
Weighted Prediction Error (top row) and AUC (bottom row) plotted against total heritability for models with 2 causal interacting pairs. Results are only displayed for a subset of weights and for H2M/H2I = 0.5, 2.0; for the full results, see Supporting Information. The results for weights that are not plotted are similar and in the same range.
