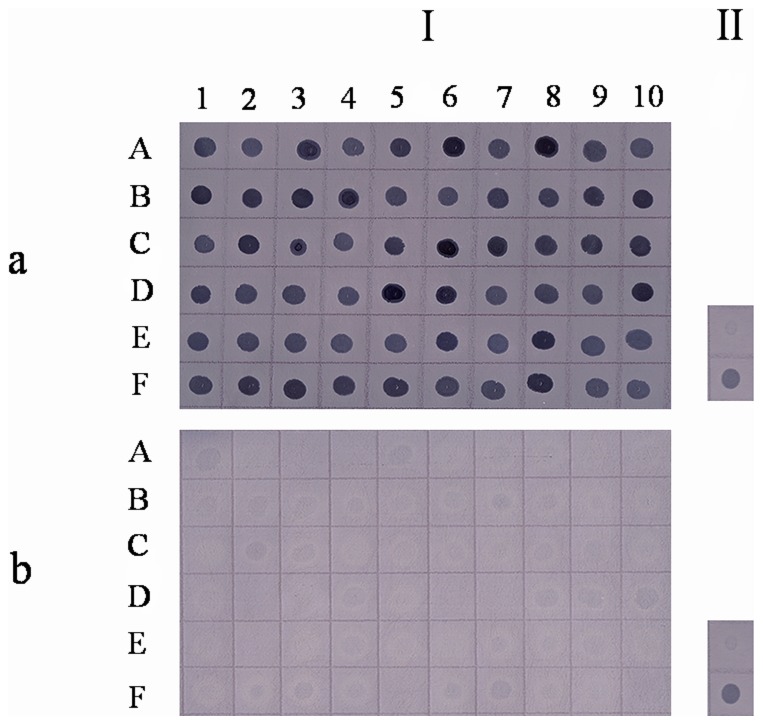
Figure 8. Southern dot blot analysis of selected SCOTS clones.

Southern dot blot showing (I) SCOTS clones (each dot corresponds to one clone in Table 2) and (II) 0.1 µg (top) or 1 µg (bottom) of genomic S. agalactiae DNA as positive controls, hybridized to a digoxigenin (DIG)-labeled probe generated from RAW264.7-derived (a) or culture-derived cDNA (b) after three rounds of normalization.
