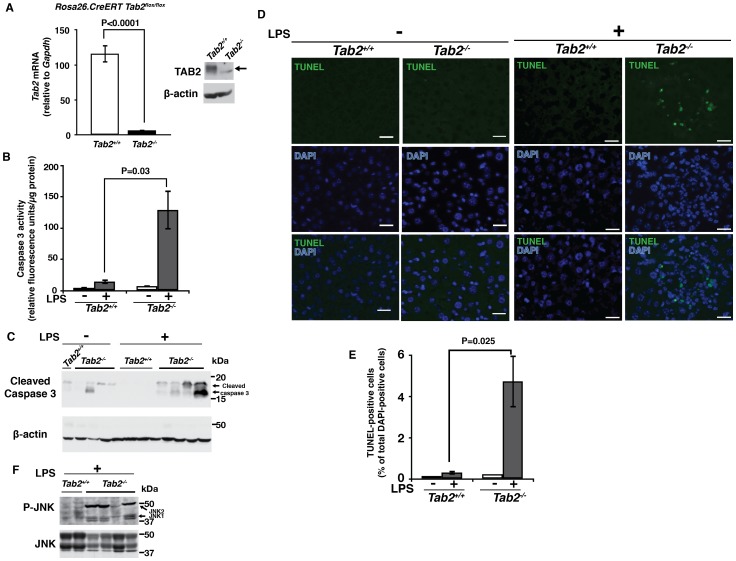
Figure 2. LPS induces liver damage in Tab2-deficient mice.
(A–C) Adult Tab2+/+ and Tab2-/- mice were generated from Tab2flox/flox and Rosa-CreER Tab2flox/flox mice by ip injection of tamoxifen as described in Experimental Procedures. (A) Tab2 expression in the liver was determined by real-time PCR and immunoblotting at more than 3 weeks after tamoxifen injection. Tab2+/+ mice n = 5; Tab2-/- mice n = 6. Means ± SEM and P values are shown. β-actin is shown as a loading control. Arrow indicates the position of TAB2. (B, C) Tab2-/ - and control littermate or age matched mice were treated by ip injection of 8 mg/kg mouse weight LPS or vehicle (PBS) for 6 h, and the liver was isolated and protein extracts were subjected to caspase 3 assay (B) and analyzed by immunoblotting with anti-cleaved caspase 3 (C). Number of mice; untreated mice n = 3; LPS-treated Tab2+/+ mice n = 4, Tab2-/- mice n = 4. Means ± SEM and P values are shown (B). (D, E) Liver sections of samples described in B and C were analyzed by TUNEL staining (D). Scale bars, 20 µm. TUNEL-positive cells per more than 2000 total liver cells per mouse were counted (E). Number of mice; untreated mice n = 2; LPS-treated Tab2+/+ mice n = 3, Tab2-/- mice n = 3. Means ± SEM and P values are shown. (F) Liver proteins described in B and C were analyzed by immunoblotting with anti-phospho-JNK and anti-JNK. Each lane in C and F represents proteins from one animal.

