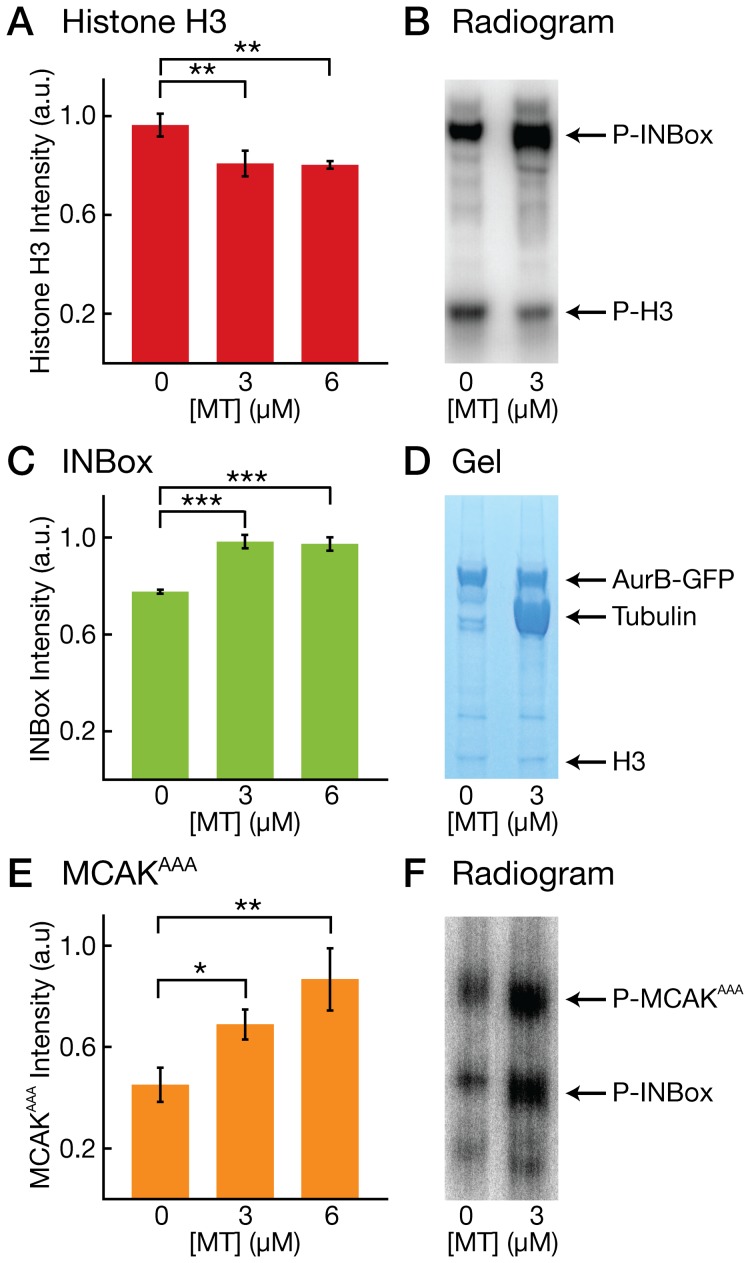
Figure 1. Microtubules sequester Aurora-B activity toward microtubule-associated substrates.
(A) Bar graph showing the normalized Histone H3 band intensity in  P radiograms at 3 different microtubule (MT) concentrations. (B) Image of a
  P radiogram showing radioactive bands corresponding to phosphorylated INBox motif (labeled) and Histone H3 (labeled) at 2 different microtubule concentrations. (C) Bar graph showing the normalized INBox band intensity in
  P radiograms at 3 different microtubule (MT) concentrations. (D) Image of an SDS-PAGE gel showing bands corresponding to Aurora-B-GFP (labeled), tubulin (labeled), and Histone H3 (labeled) at 2 different microtubule concentrations. The band for the INBox construct, at 52 kDa, is masked by the tubulin band. (E) Bar graph showing the normalized MCAKAAA band intensity in
  P radiograms at 3 different microtubule (MT) concentrations. (F) Image of a
  P radiogram showing radioactive bands corresponding to phosphorylated MCAKAAA (labeled) and the INBox motif (labeled) at 2 different microtubule concentrations.

