
Fig. 5.
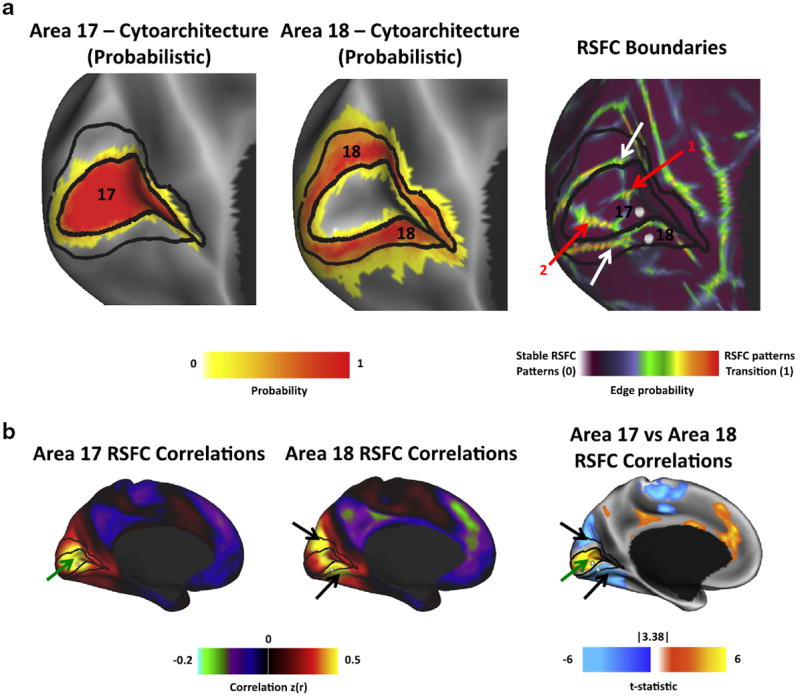
RSFC-Boundary Mapping compared to cyto-architectonically-defined probabilistic areas (PA) 17 and 18. (a) Medial occipital view of PA 17 and PA 18 (Fischl et al., 2008) and 120-subject RSFC-Boundary map. Black lines indicate reasonable boundaries between and around areas 17 and 18 as described in Van Essen et al. (2012). The white arrows indicate dorsal and ventral RSFC boundaries that appear to closely correspond to the architectonic boundary. The RSFC-based borders are also apparent in each of the individual groups (see Fig. 2). Red arrow 1 indicates a boundary along the calcarine fissure that may correspond to the horizontal meridian of PA 17 (Visual Area 1). Red arrow 2 indicates a boundary that is likely due to susceptibility artifact at the occipital pole (see Fig. 8a). (b) Correlation maps generated from ventral PA 17 and PA 18 seeds (gray balls) and the differences between them. Green and black arrows highlight the locations of strongest correlations for seeds in PA 17 and PA 18, respectively. The differences between the two seeds can be best appreciated on the statistical difference map, which is calculated as a surface vertex-wise two-sample t-test between the correlation maps of the two seeds. Note that the contour of the difference image follows the PA 17/18 boundary.