
Fig. 7.
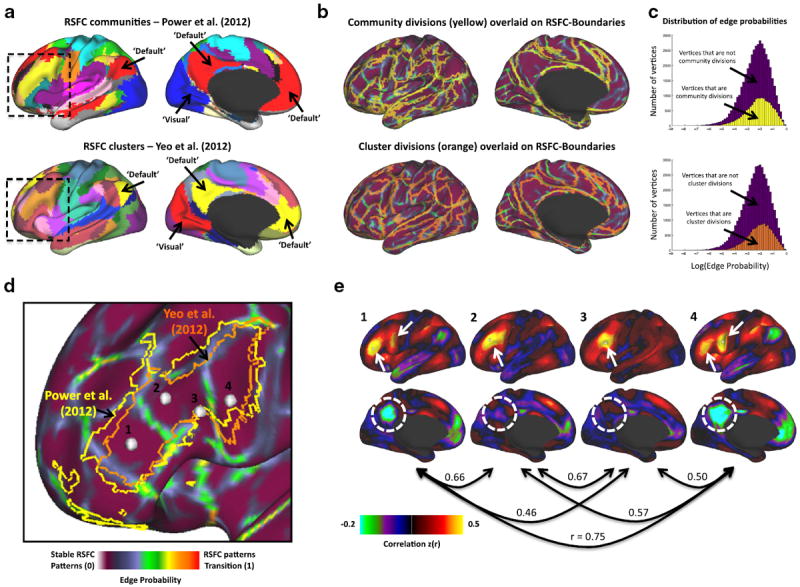
RSFC-Boundary Mapping compared to RSFC-defined systems boundaries. (a) Large-scale cortical systems derived from RSFC community detection (Power et al., 2011) and clustering (Yeo et al., 2011). Dotted boxes indicate approximate view in (d). (b) RSFC-based system divisions (community divisions from Power et al., 2011; cluster divisions from Yeo et al., 2011) overlaid on a 120-subject RSFC-Boundary map depict the correspondence between the two types of maps. (c) Histograms depicting the distribution of edge probabilities for locations that were identified as system divisions as defined by Power et al. (yellow) and Yeo et al. (orange) and locations that were not identified as system divisions (purple in both). Note that system division edge probabilities are slightly right shifted relative to the edge probabilities of the remaining locations (i.e. tend to have higher edge probabilities), but there remain many locations with high edge probabilities that are not accounted for by system divisions. (d) close-up of left lateral frontal cortex showing frontal–parietal system borders overlaid on RSFC-Boundary map. Four white balls indicate local minima in the RSFC-Boundary map. (e) The spatial correlation (Pearson’s r) between the four correlation maps generated from the local minima positions indicated in (d). Note that the most anterior (1) and most posterior (4) seeds have very similar correlation maps. The two intermediate seeds (2,3) show similar patterns as seeds 1 and 4, but also differ markedly in certain regions, e.g. along the lateral frontal cortex (arrows) and in posterior cingulate cortex (dotted circle), providing evidence that there are numerous areas within a single system division.