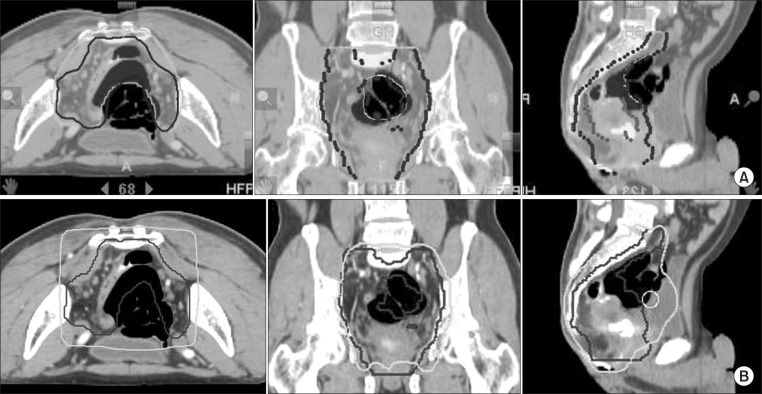
Fig. 4.
Dose distribution of Tomotherapy (A) and 3-dimensional radiotherapy (B). We can see that isodose line in Tomotherapy planning is shaped into geometrical configuration of the planning target volume (PTV), and the irradiated volume of the bowel and the bladder at high dose is smaller in Tomotherapy than in 3-dimensional radiotherapy. Gray line represents 95% isodose line and black contour is PTV.

