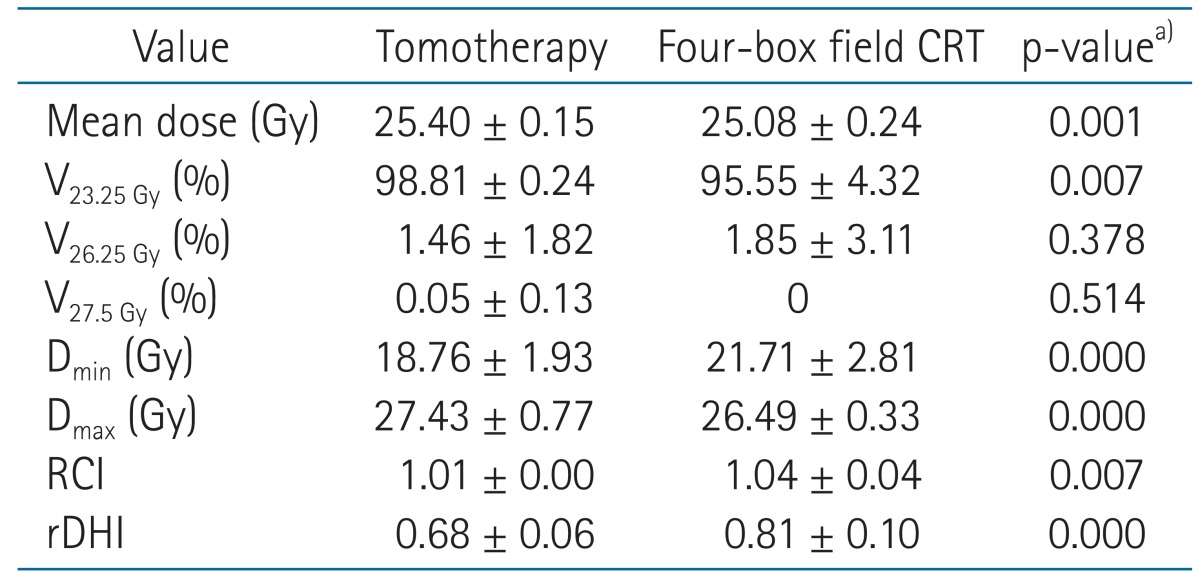
Table 1.
Evaluated dosimetric parameters of PTV for comparison of two different plans

Values are presented as mean ± standard deviation.
PTV, planning target volume; CRT, conformal radiotherapy; Vn Gy, percentage of the volume receiving radiation ≥ n Gy; Dmin, minimum dose to the PTV; Dmax, maximum dose to the PTV; RCI, radiation conformity index (VPTV / V95% of prescribed dose), rDHI, radical dose homogeneity index (Dmin / Dmax in PTV ≤ 1).
a)Mann-Whitney test, except mean dose (compared using t-test) which showed normal distribution.
