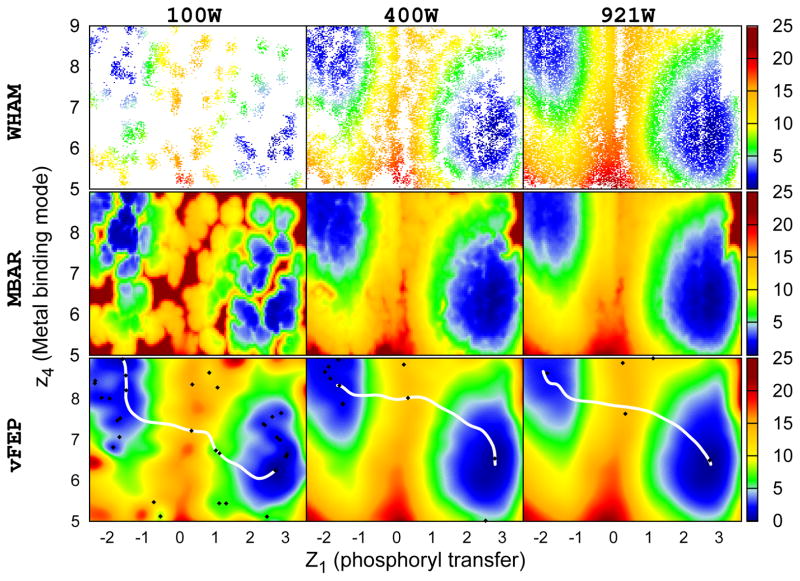
Figure 6.
The 2D free energy profile of HHR ribozyme (see Wong et al. 76 for reaction coordinate definitions). WHAM, MBAR/gKDE, and vFEP results are shown in the upper, middle, and bottom rows respectively. Results obtained from 100, 400, and 921 windows are shown in the left, middle, and right columns respectively. For each window data was collected every 100 fs for a total of 5 ps, resulting in 50 data points per window. Calculations with 100 and 400 windows used randomly selections from the original 921 windows. White space in the WHAM results indicate empty histogram bins. WHAM gives noticeably sparser results compared to the original data set. Conversely, 2D-vFEP gives a rough, but smooth, estimation of the free energy profile with only 100 windows. The two coordinates are in Å. The color scheme of the free energy profile is shown at the right side color bar with units in kcal/mol. The black diamonds and the white lines shown in the vFEP contour maps are the saddle/minimum points and the possible paths found by the NEB method, respectively.

