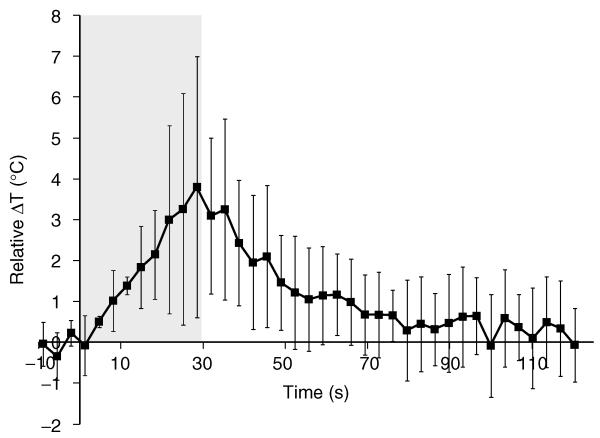
Figure 7.
Relative difference in temperature due to HIFU-mediated heating with and without PSNE, plotted as a function of time during and after sonication. The gray box indicates the time when the tumor was sonicated with an acoustic power of 5.2 W. Error bars represent the standard deviation of the data from three rabbits.

