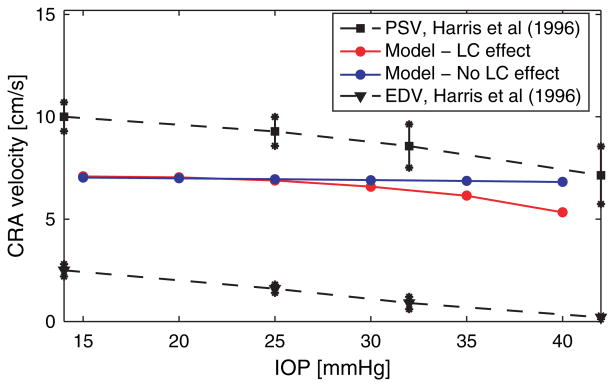
Fig. 11.
Effect of IOP elevation on CRA centerline velocity. Comparison between the predictions of the mathematical model in the case when the effect of the lamina cribrosa is included (red line) or not included (blue line) and the in vivo measurements for peak systolic velocity (PSV) and end diastolic velocity (EDV) (dashed lines) obtained via Color Doppler Imaging by Harris et al.(51)

