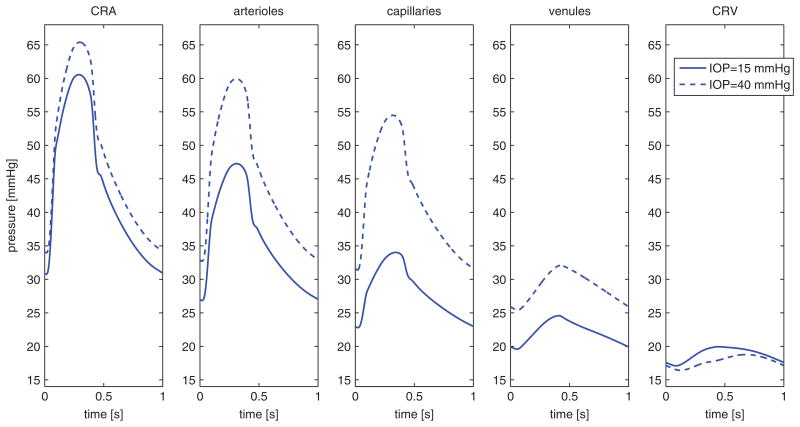
Fig. 13.
Pressure waveforms in the five network compartments computed for IOP = 15 mmHg and 40 mmH. These results suggest that the IOP-induced compression on the CRV is more significant than on the CRA, leading to an overall increase of blood pressure in the intraocular compartments (arterioles, capillaries and venules) as IOP increases.

