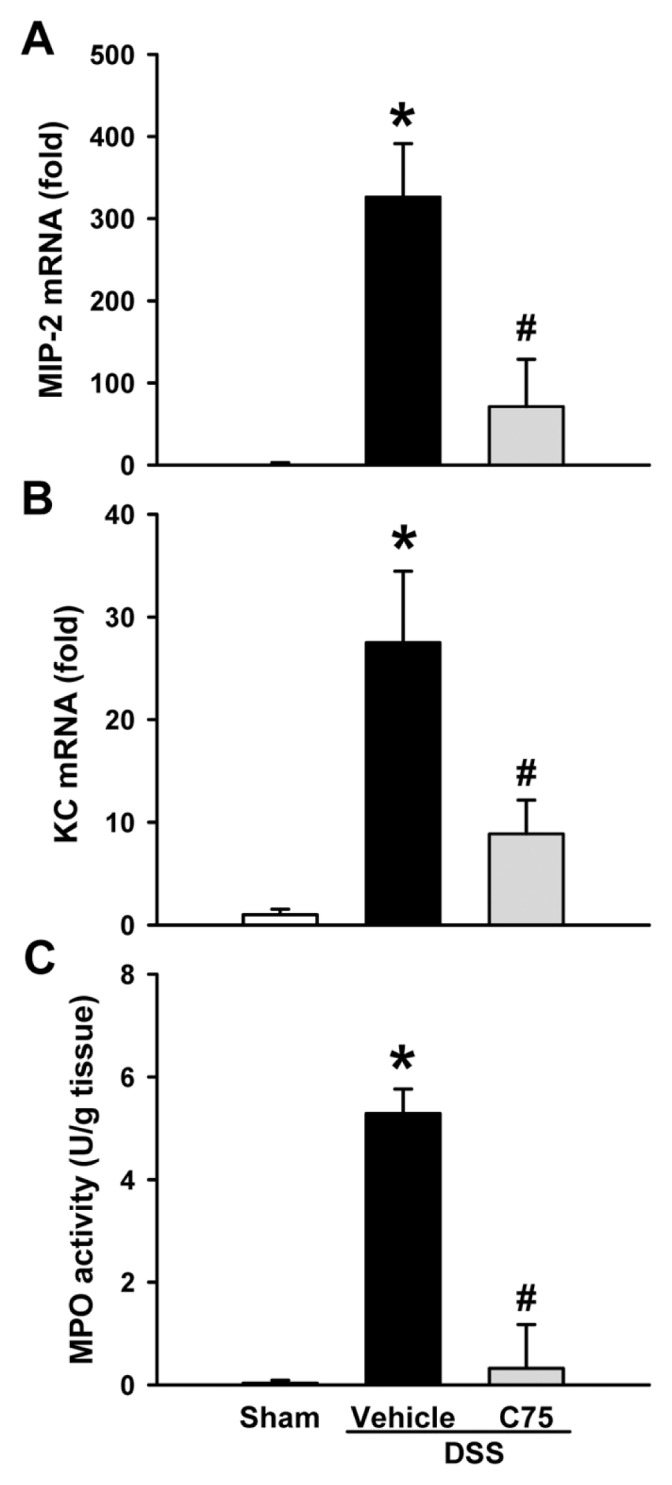
Figure 4.

Effect of C75 treatment on chemokine expression and MPO activity in DSS colitis. The mRNA levels of MIP-2 (A) and KC (B) in colons from sham, vehicle and C75-treated groups at d 8. Expression in the sham group is designated as 1 for comparison. (C) Colon MPO activity, a marker for neutrophil infiltration, was determined spec-trophotometrically. Data are expressed as mean ± SEM (n = 5 per group). *P < 0.05 versus sham; #P < 0.05 versus vehicle.
