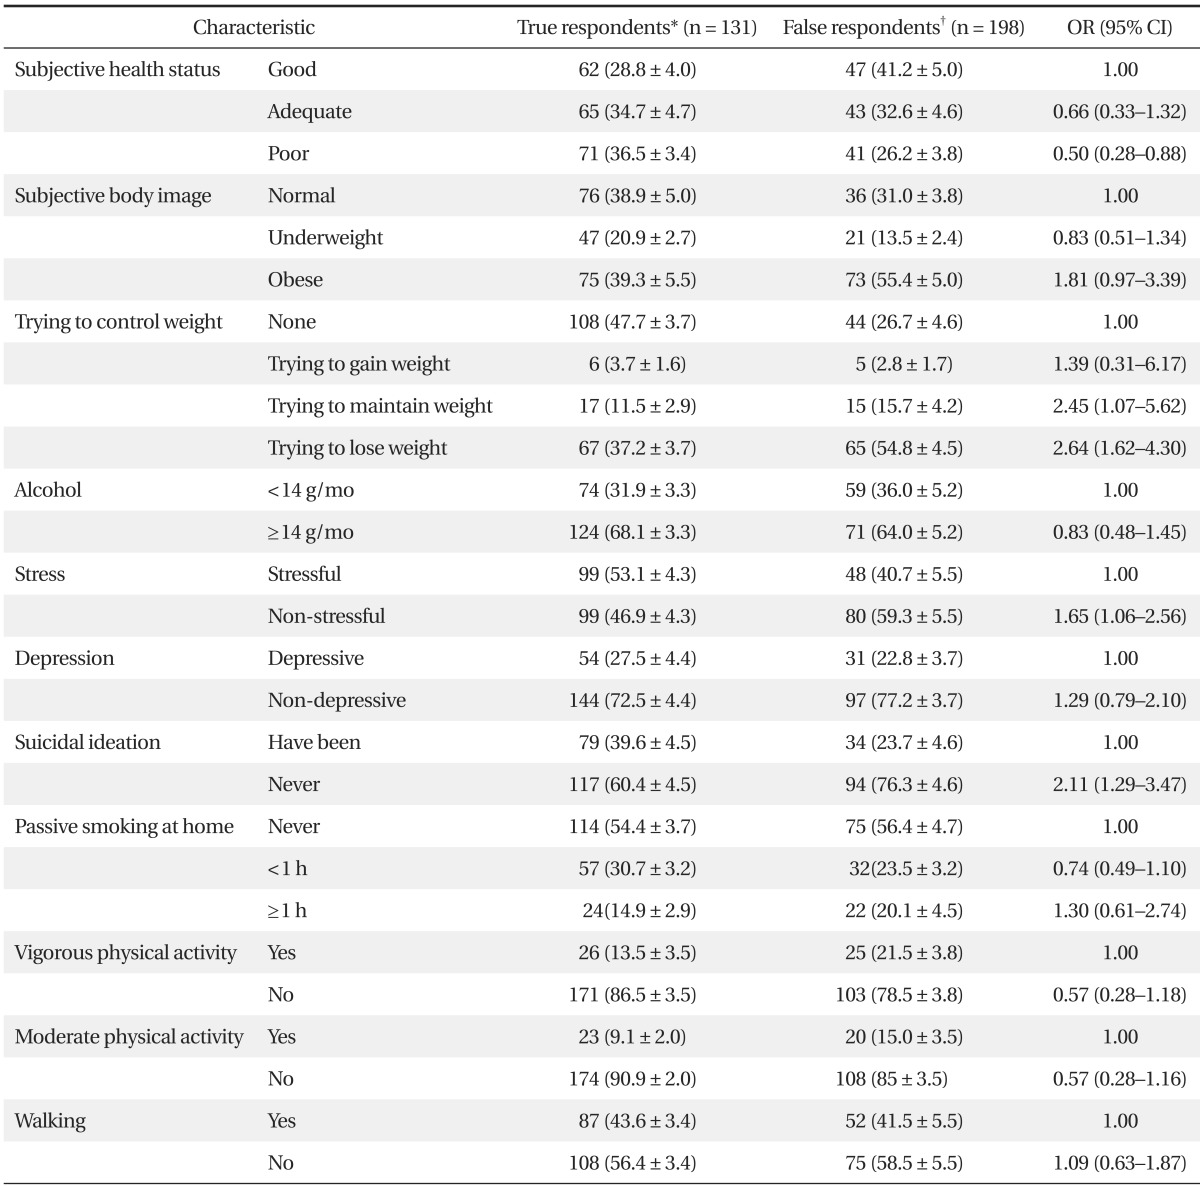
Table 2.
Psychological and lifestyle characteristics of false and true respondents among Korean women smokers

Analyzed by logistic regression analysis. Values are presented as unweighted numbers (weighted percentage ± SE).
OR: odds ratio, CI: confidence interval.
*Individuals who responded accurately to the self-reported smoking survey. †Self-reported non-smokers with urinary cotinine >100 ng/mL.
