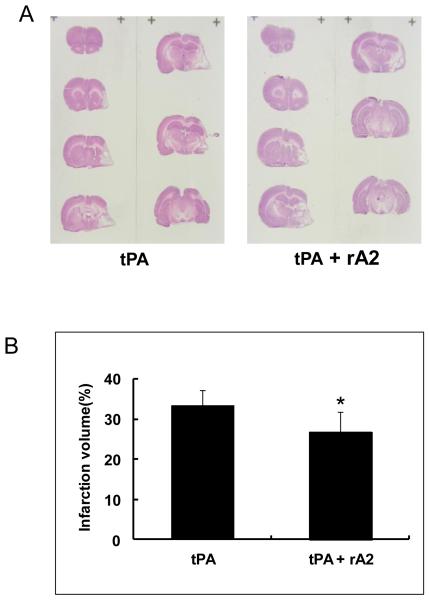
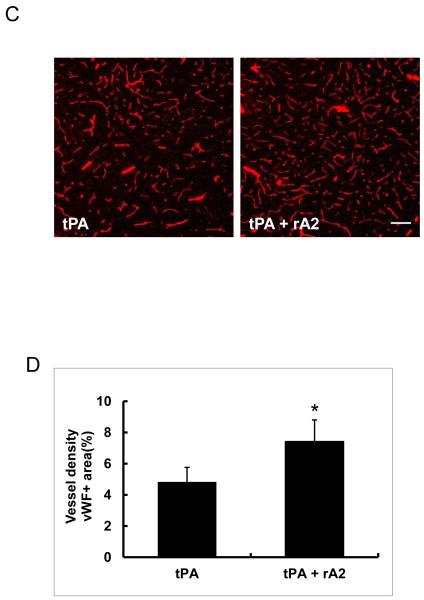
Figure-2.
Brain Infarction volume and vessel density at 28 days after stroke. A. Representative H&E stained brain sections. B. Quantitation of brain infarction volume. *P<0.05, n=17 for tPA alone group, and n=24 for the combination group. C. Representative immunohistochemistry images of cerebral vessels labeled by endothelial cell maker vWF. Scale bar=100 μm. D. Quantitation of cerebrovascular density. *P<0.05, n=6 per group.


