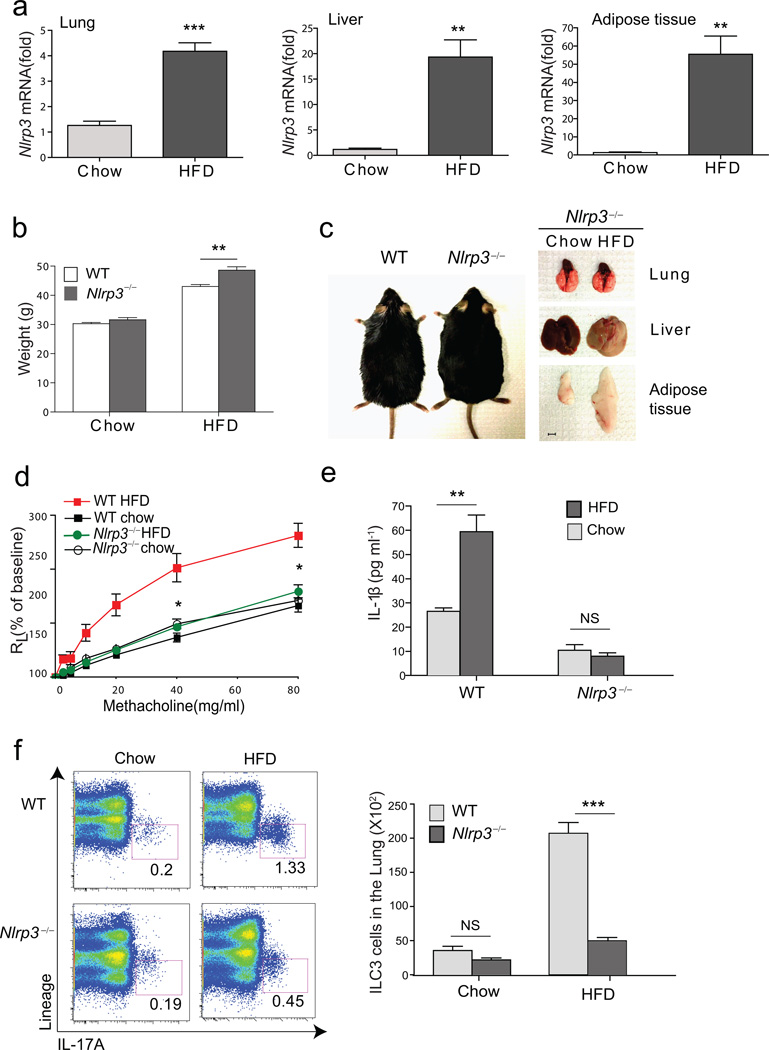
Figure 4. HFD increases NLRP3, which is required for AHR.
a. Total RNA was extracted from the lung, liver and adipose tissue and assessed for Nlrp3. Fold induction of Nlrp3 mRNA was calculated based on GAPDH expression. **p<0.01 and ***p<0.001, mRNA level from mice fed on HFD compared to chow group. (Student’s t-test)
b. Graph represent grams of weight gain in WT or Nlrp3−/− mice. **p<0.01, WT mice on HFD compared to Nlrp3−/− mice on HFD group. (Student’s t-test)
c. WT and Nlrp3−/− mice 3 months after HFD (left). Representative pictures of lung, liver and epididymal adipose tissue from Nlrp3−/− mice fed on chow or HFD (right). Scale bar indicates 5mm
d. Development of obesity induced AHR was compared in WT and Nlrp3−/− mice. Graph represents the changes in lung resistance (RL). *p<0.05, Nlrp3−/− mice on HFD were compared to WT mice on HFD group (Two-way ANOVA).
e. IL-1β levels in the culture supernatant of lung cells from WT and Nlrp3−/− mice. The data shown are means ± SEM. **p<0.01, supernatants from HFD group were compared to chow group. (Student’s t-test)
f. Lungs were taken from chow or HFD fed mice and stimulated with PMA/ionomycin for 5 hr. −IL-17A+ ILC3 cells in WT mice (upper panel) or Nlrp3−/− mice (lower panel) were assessed by FACS. Graph represents the total number of ILC3 cells in the lung. ***p<0.001, ILC3 cells in WT mice were compared to Nlrp3−/− mice. (Student’s t-test).

