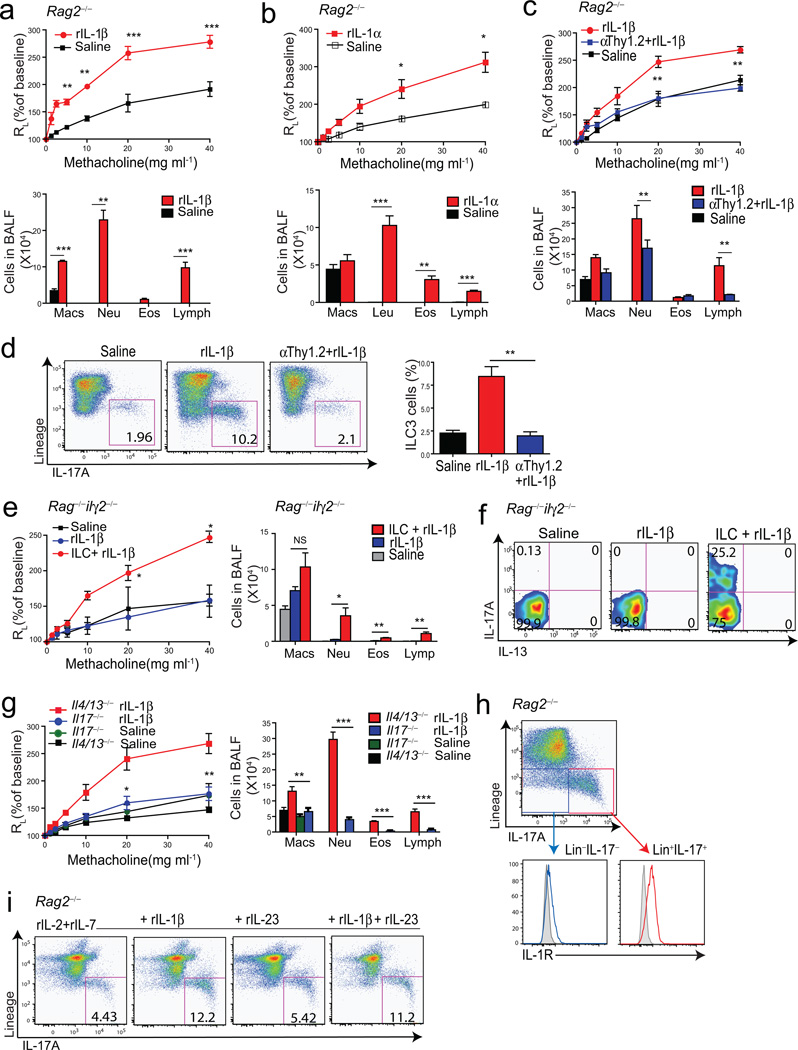
Figure 5. IL-17 producing innate lymphoid cells are required for the development of AHR.
Graphs represent the changes in lung resistance (RL) (upper panels) and BAL fluid cell counts (lower panels) after rIL-1β (a) or rIL-1α (b) treatment. For AHR, **p<0.05, and ***p<0.001, rIL-1β or rIL-1α treated mice were compared to saline treated mice (Two-way ANOVA). For BAL fluid, **p<0.01, and ***p<0.001, rIL-1β vs saline (a), **p<0.01, rIL-1α vs saline (b) (Student’s t-test).
c. Changes in lung resistance (RL) (upper panel) and BAL fluid cell counts (lower panel) after depletion of ILCs. For AHR, **p<0.01, rIL-1β treated mice were compared to anti-Thy1.2 mAb treated mice (Two way ANOVA). For BAL fluid, **p<0.01, and ***p<0.001, rIL-1β vs anti-Thy1.2 mAb+rIL-1β (Student’s t-test).
d. ILC3 cells in the lung (left panel), and total number of ILC3 cells in each group (right panel). **p<0.01, rIL-1β treated mice were compared to anti-Thy1.2 mAb treated mice (Student’s t-test).
e. Changes in lung resistance (RL) in Rag2−/−Il2rγ−/− mice after adoptive transfer of ILC3 cells (Lin−CCR6+). ***p<0.001, comparing Rag2−/−Il2rγ−/− mice treated with rIL-1β receiving or not receiving ILC3 cells (Two-way ANOVA). Cells in BAL fluid (right panel). *p<0.05, and ***p<0.001, ILC3 cells +rIL-1β vs rIL-1β group (Student’s t-test).
f. IL-17A and IL-13 production from adoptively transferred ILC3 cells.
g. Changes in lung resistance (RL) in Il4/Il13−/− and Il17−/− mice after rIL-1β treatment. *p<0.05, and **p<0.01, rIL-1β treated Il4/Il13−/− mice were compared to rIL-1β treated Il17−/− mice (Two way- ANOVA). Cells in BAL fluid (right panel). ** p<0.01, and ***p<0.001, rIL-1β treated Il4/Il13−/− mice were compared to rIL-1β treated Il17−/− mice (Student’s t-test).
h. IL-1R expression on ILC3 cells. Lin−IL-17+ cells (red) express higher level of IL-1R compared to Lin−IL-17− cells (blue). Shaded histogram: isotype control.
i. Cells were taken from rIL-1β treated Rag2−/− mice then cultured in vitro to induce ILC3 cells.

