Figure 3.

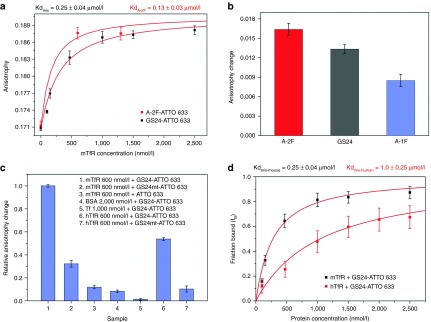
Fluorescence anisotropy assay. (a) Titration of GS24-ATTO 633 (50 nmol/l) with mTfR (0–2,500 nmol/l) at 25 °C. A-2F binding was examined at 600 and 1,300 nmol/l, the latter considered as concentration close to the saturation. The curve of the mixture (black squares) was obtained by fitting the anisotropy values as a function of mTfR concentration. The fit afforded both Kd and AB (anisotropy in saturating condition). The curve of A-2F (red squares) was obtained as above, using the value of AB obtained from the fitting of GS24 anisotropy curve. (b) Binding efficiency of the two folds and GS24 was measured at [mTfR] = 600 nmol/l. In this case the anisotropy change is defined as the difference between aptamer anisotropy in the presence and in absence of protein. (c) Aptamer selectivity control experiments. Anisotropy change was measured for GS24 mutant (GS24mt) and unconjugated ATTO 633 (50 nmol/l) in presence of 600 nmol/l mTfR respectively. Next, GS24 aptamer selectivity was tested incubating the sample (50 nmol/l labeled GS24) with saturating amounts of BSA, Tf and hTfR. The anisotropy change of each sample was compared with the anisotropy measured in the presence of 600 nmol/l mTfR. GS24mt was also tested in presence of 600 nmol/l of hTfR (d) Fraction bound of aptamer (fB) for mouse (black squares) and human (red squares) TfR was calculated from the corresponding anisotropy titration curves. The mixture of two folds (GS24) showed a different affinity for each protein.
