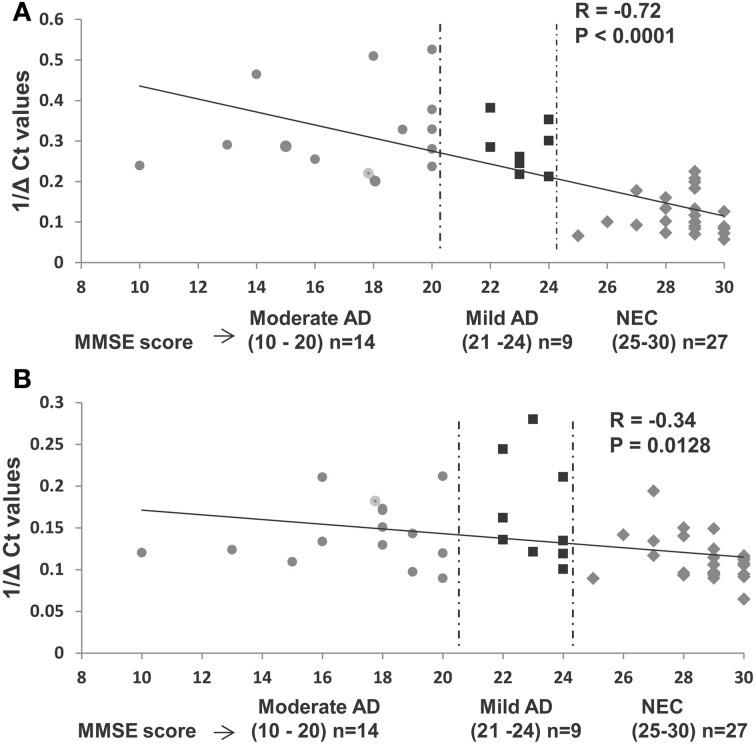
Figure 6.
Relationship between expression levels of miR-34c and miR-34a in plasma with Mini-Mental Status Examination (MMSE) scores in selected samples of age-matched groups. (A) Plasma expression levels of miR-34c represented by inverse ΔCt, plotted against corresponding MMSE scores. A high Pearson correlation coefficient value of −0.72 indicates a strong correlation between MMSE scores and 1/deltaCt values, P < 0.0001. (B) Expression levels of miR-34a in plasma of AD and NEC individuals represented by inverse ΔCt, plotted against corresponding MMSE scores. A low Pearson correlation coefficient value of −0.34 indicates a weak correlation between the MMSE scores and 1/deltaCt values, P = 0.012. Data points of Mini-Mental Status Examination (MMSE) score are shown as follows: ( ) moderate AD (score 10–20), (
 ) mild AD (score 21–24), and (
 ) NEC (score 25–30).

