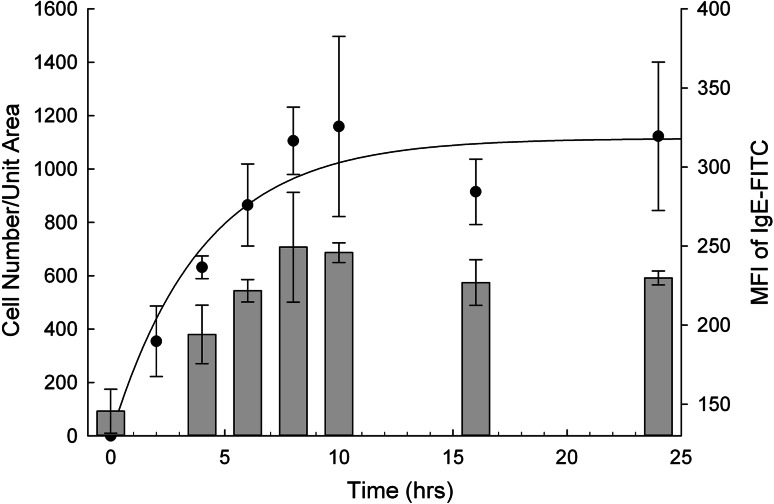
Fig. 1.
Time course of RBL-703/21 binding to IgE-coated microarray per unit area. RBL-703/21 cells were sensitised with 10 μg/mL monoclonal human IgE-FITC for different lengths of time and captured on FAST slides coated with polyclonal anti-human IgE. After washing and fixation, images were taken and the number of cells captured was determined by image analysis (left axis, full circles). Surface-bound IgE was measured by flow cytometry and expressed as Median Fluorescence intensity (right axis, bars). Data are expressed as mean ± SD of three separate experiments

