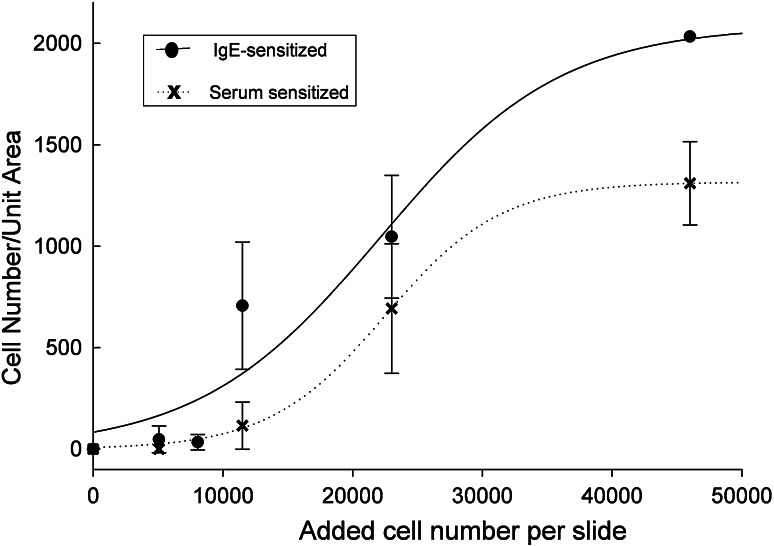
Fig. 2.
Binding of cells per unit area in dependence of initial cell density added to the array slides. RBL-703/21 cells were sensitised overnight with 2 % human serum (crosses, dotted line) or myeloma IgE (black circles, continuous line) and captured with polyclonal IgE printed on FAST slides. Varying cell densities were incubated with the arrays and the total amount of cells bound evaluated as described in Methods. Data are shown as mean ± SD of three separate experiments. Sigmoidal best fit curves for both conditions are shown

