
Figure 4.
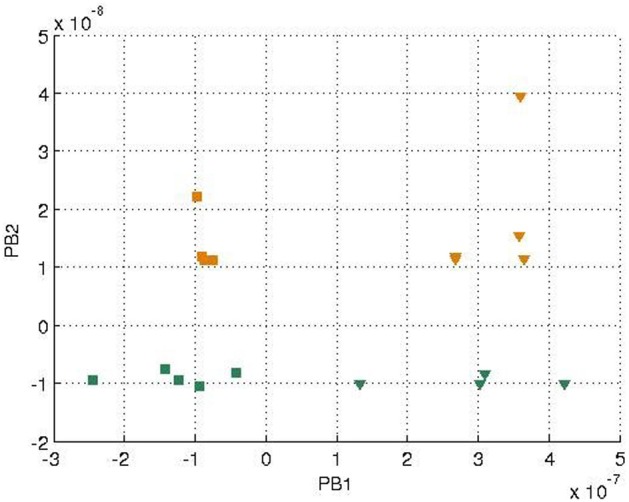
Values of two sets of PB units in the two streams after training. The square markers represent those PB units after the square curves training and the triangle markers represent those of the cosine curves training. The colors of the markers, yellow and green, represent the colors of the balls used for training.