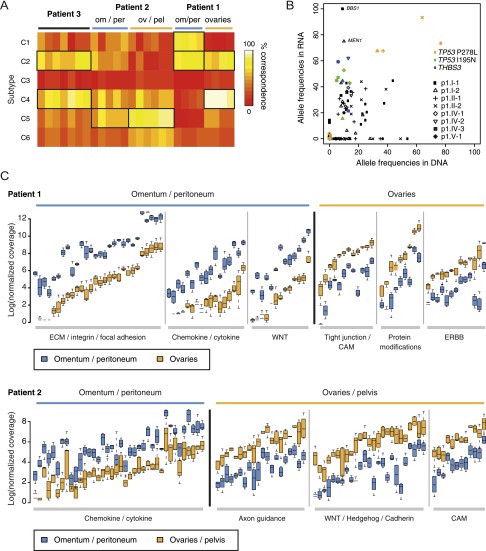
Figure 3.
(A) Heat map of the percentage concordance of each sample with the subtypes of ovarian cancer presented by Tothill and colleagues (Futreal et al. 2004; Tothill et al. 2008; Santarius et al. 2010). C1, high stromal response; C2, high immune signature; C3, low malignant potential (LMP) signature; C4, low stromal response; C5, mesenchymal signature; C6, low grade endometrioid. (B) Allele frequencies of coding mutations in RNA and DNA for patient 1. (C) Branch-specific expression differences of genes involved in major signaling pathways for patient 1 (top) and patient 2 (bottom).

