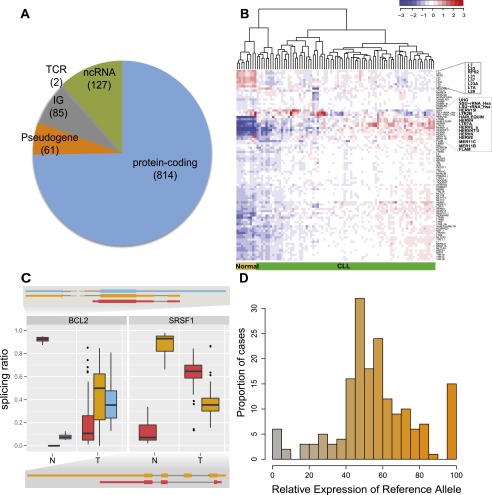
Figure 1.
CLL transcriptional landscape. (A) Distribution of differentially expressed genes between tumor and normal samples according to their coding potential. (B) Normalized expression of transposable elements (TEs). Blue indicates low expression and red high expression, with some of the TEs differentially expressed highlighted. (C) Genes with condition-specific splicing ratios. Two of the genes with the most significant differences in the relative abundance of alternatively spliced isoforms between tumor and normal samples are shown. The boxplots correspond to the distribution of the relative abundances for each transcript (represented with a specific color) in the normal (left, N) and tumor (right, T) populations. The exonic structure of each transcript is represented using the same color scheme. (D) Allele-specific expression of somatic mutations. The relative expression of the reference allele, as derived from RNA-seq reads, was binned, and the number of cases in each bin plotted. The color gradient reflects the relative expression of the two alleles (the value that labels the bin in the x-axis).

