
Figure 1.
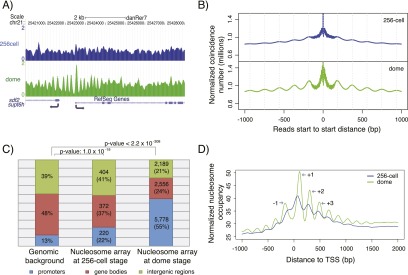
Well-positioned nucleosome arrays are established at promoters during genome activation. (A) Sample profile of nucleosome organization around the promoter of supt6h at the 256-cell (blue, before the maternal-zygotic transition) and dome (green, after the maternal-zygotic transition) stages. Gaussian smoothing of midpoints of nucleosomal DNA was used to create the nucleosome profile. (B) Relationship between the position of adjacent nucleosomes before (blue) and after (green) the maternal-zygotic transition. The total number of nucleosomal sequencing reads with a start-to-start distance equal to the value on the x-axis is shown. (C) Genomic distribution of well-positioned nucleosome arrays at the 256-cell and dome stages. Promoters: regions from 2 kb upstream of the TSS to 2 kb downstream from the TSS. Gene bodies: regions from 2 kb downstream from the TSS to the transcription termination sites (TTS). Intergenic regions: all other genomic regions. (D) Average promoter nucleosome organization across all genes before (blue) and after (green) the maternal-zygotic transition. All reads were extended to 147 bp; the middle 73 bp were taken, piled up, and normalized by sequencing coverage. The +1, +2, +3, and −1 nucleosomes around TSS at the dome stage are indicated.