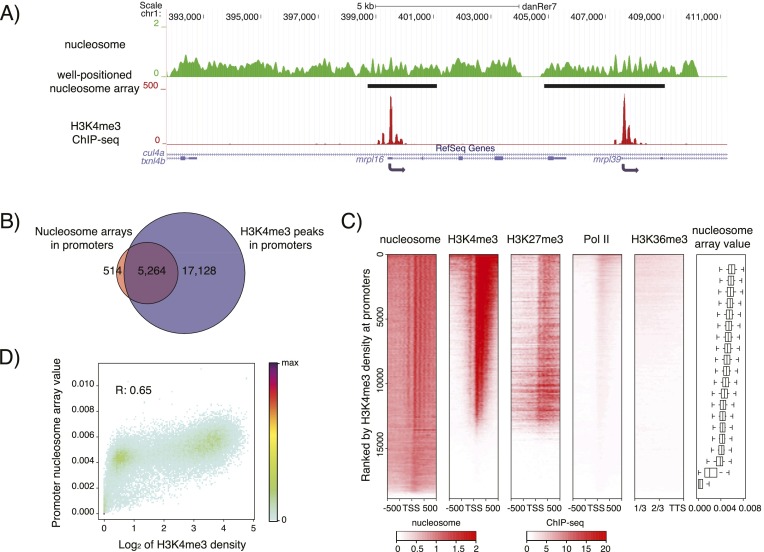
Figure 2.
Well-positioned nucleosome arrays and H3K4me3 co-occur at promoters at the dome stage. (A) Sample profile of nucleosome organization (green) and H3K4me3 (red) around mrpl16 and mrpl39. Gaussian smoothing of the midpoints of nucleosomal DNA was used to represent the nucleosome profile. Identified well-positioned nucleosome arrays are indicated by black bars. (B) Venn diagram showing the overlap of well-positioned nucleosome arrays and H3K4me3 peaks at promoters. A 100-bp overlap was used as a minimal required cutoff. (C) Heatmaps of nucleosome organization; H3K4me3, H3K27me3, and RNA Pol II signals around TSSs; as well as the H3K36me3 signal in the last 2/3 regions of the concatenated exons. Genes are ranked by the H3K4me3 signal at their promoter. Each horizontal line represents the average signal for 100 genes. Color represents RPKM value. Genes were evenly grouped into 20 bins based on H3K4me3 density at their promoters, and the associated distribution of nucleosome array values at these promoters is given in the boxplot. In heatmaps, short genes (<1 kb) were excluded, and if one gene has multiple annotations, only the one with the strongest H3K4me3 signal was kept. A total of 18,890 genes was used. (D) The correlation between H3K4me3 density and nucleosome array value at the promoters. H3K4me3 density is calculated as the log2 transformed RPKM + 1 for each promoter.

