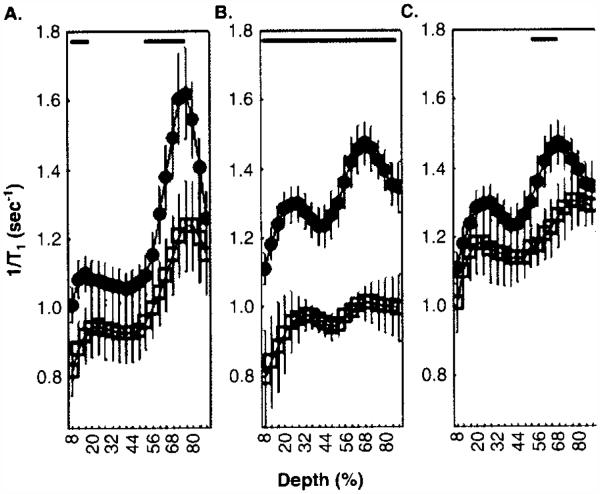
Figure 2. ACEi and angiotensin II subtype 1 receptor antagonist suppress retinal manganese uptake, particularly in the outer retina.
Central (−0.4 – 1 mm from the optic nerve head) retinal manganese uptake (i.e., (1/T1)) profiles were compared between non-treated non-diabetic control rats (filled black circles) and non-diabetic control rats (open square treated with (A) captopril (B) enalapril, or (C) losartan. T1 data acquisition was performed using a 7T Clinscan MRI as previously published [81]. Other details are in text. Data were analyzed as previously described and shown here as a function of distance from the retina/non-retina borders, where 0% is the vitreous/retina border and 100% is the retina/choroid border [81]. Regions near borders were not included in the analysis because these regions likely include some signal from outside of the retina. For those areas tested, lines above profiles indicate significant differences in manganese uptake as indicated (p < 0.05, two-tailed test (bold black lines); details on statistical analysis can be found elsewhere) [81].

