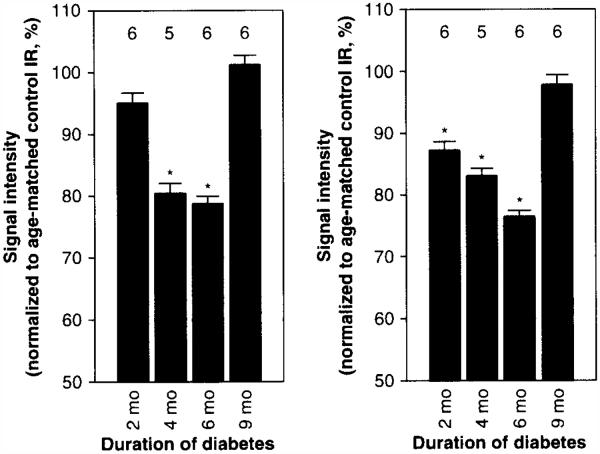
Figure 3. Summary of natural history of manganese uptake for dark adapted inner retina (left panel) and outer retina (right panel) of diabetic Sprague–Dawley rats.
Error bars are SEM. The y-axis scale starts at a signal intensity of 50 (arb. units) because this is the pre-manganese baseline level determined from rats not injected with manganese (data not shown). T1 weighted data acquisition was performed using a 4.7T MRI as previously published [41]. Data were analyzed as previously described [41]. Numbers over bars are numbers of animals studied. Details on statistical analysis can be found elsewhere [41].
*p < 0.05 from 100%.

