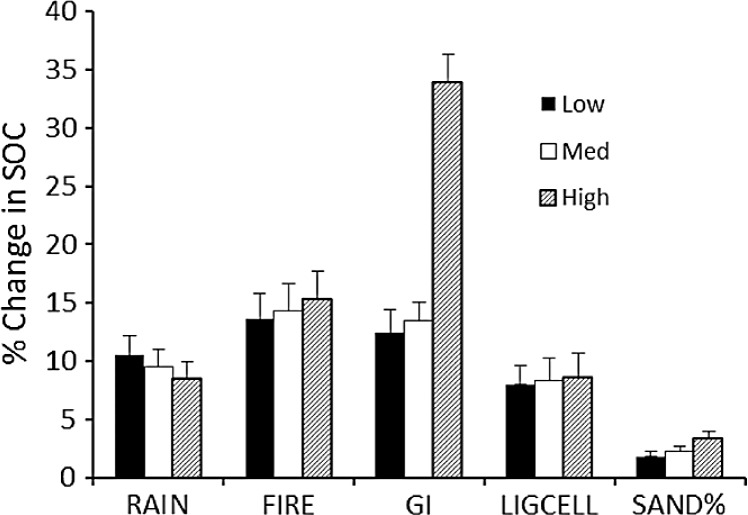
Figure 5. Sensitivity analysis for the SNAP soil carbon model.
Model sensitivity analysis of the mean (+SE) absolute value of percent change in model-predicted equilibrium SOC (SOCeq). Change results from variation in each input parameter by +10% while holding other parameters constant. Sensitivities (% change in equilibrium SOC ± SE) were calculated for low, medium and high initial values of each parameter (Table 3).

