
Figure 4.
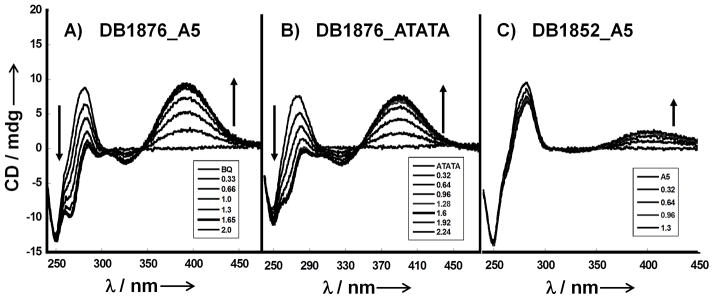
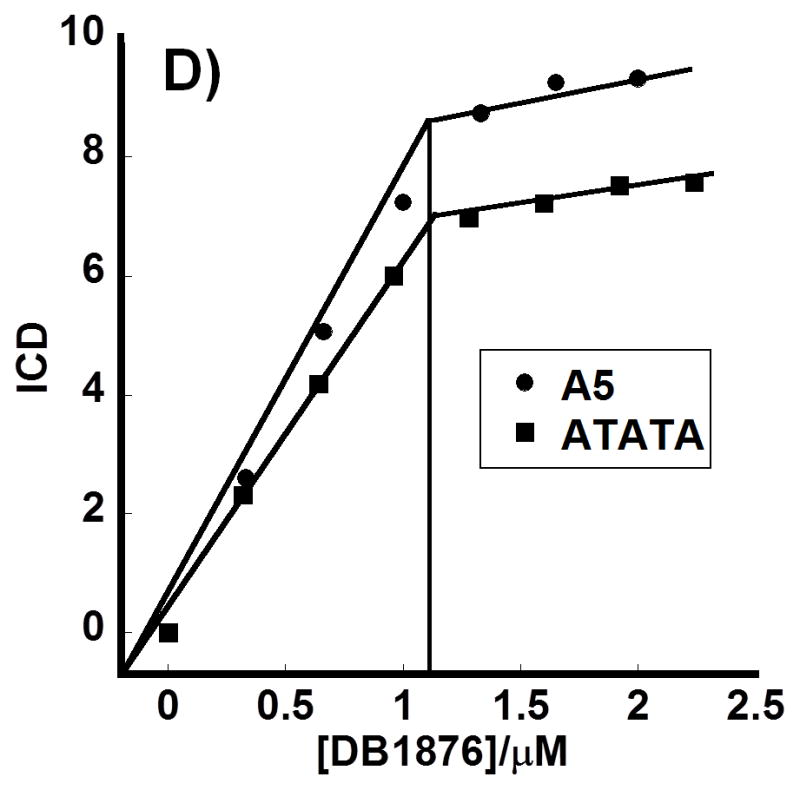
Circular dichroism spectra: A) DB1876-A5 B) DB1876-ATATA C) DB1852-A5 titrations for added ratios (compound to DNA hairpin) from bottom to top range from 0.32 to 3.0 D) A plot of induced CD (ICD) vs DB1876/DNA ratio
Official websites use .gov
A
.gov website belongs to an official
government organization in the United States.
Secure .gov websites use HTTPS
A lock (
) or https:// means you've safely
connected to the .gov website. Share sensitive
information only on official, secure websites.
Circular dichroism spectra: A) DB1876-A5 B) DB1876-ATATA C) DB1852-A5 titrations for added ratios (compound to DNA hairpin) from bottom to top range from 0.32 to 3.0 D) A plot of induced CD (ICD) vs DB1876/DNA ratio